Abandoning the Top-Picking Trap: An Institutional Framework for Market Structure and Wave Dynamics
Why are you always catching falling knives and shorting before massive rallies? Discard retail "top-picking" mentalities. Master institutional Smart Money Concepts (SMC) to redefine Market Structure, precisely identify BOS and MSS/ChoCh, and sync with the market's true rhythm.
TL;DR (Core Summary): "The trend is your friend" is the most abused cliché in trading, yet 90% of retail traders lack an objective, mathematical standard to actually define the "trend."Reject Subjective Prediction: Market price action is not random; it is driven by high-frequency algorithms and institutional Order Flow. Attempting to "pick the top" during a secular bull run or "catch a falling knife" in a bear market is equivalent to standing in front of a speeding freight train.The Ironclad Laws of Market Structure: A trend is fundamentally geometric. A bullish structure is strictly defined by Higher Highs (HH) and Higher Lows (HL); a bearish structure is dictated by Lower Highs (LH) and Lower Lows (LL).The Matrix of Impulses and Corrections: Price moves in a "breathing" rhythm. Institutions only buy during Corrective Waves when the price pulls back into a Discount Zone. They never chase the tail end of an Impulsive Wave.The Sole Objective Reversal Confirmation (MSS/ChoCh): A trend does not instantly terminate because of a macroeconomic news headline. The underlying logic only reverses when a critical Swing Point is substantively breached, triggering a Market Structure Shift (MSS) or Change of Character (ChoCh).
Introduction: Why Are You Addicted to the Fatal Trap of "Left-Side Trading"?
In the brutal zero-sum arena of financial markets, the retail crowd universally suffers from a highly dangerous cognitive bias: An obsession with "left-side trading"—the desperate desire to act as the market oracle who buys the absolute bottom and shorts the exact top.
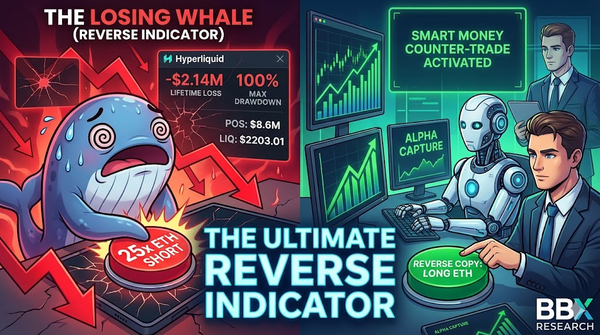
When an asset embarks on a massive Impulse Move, retail traders often succumb to a "fear of heights." Instead of riding the momentum, they subjectively assume, "It's gone up too much, it has to pull back," and repeatedly attempt to short the rally. Ultimately, they are mercilessly liquidated by institutional Short Squeezes, their stop-losses serving as the very fuel that propels the price even higher.
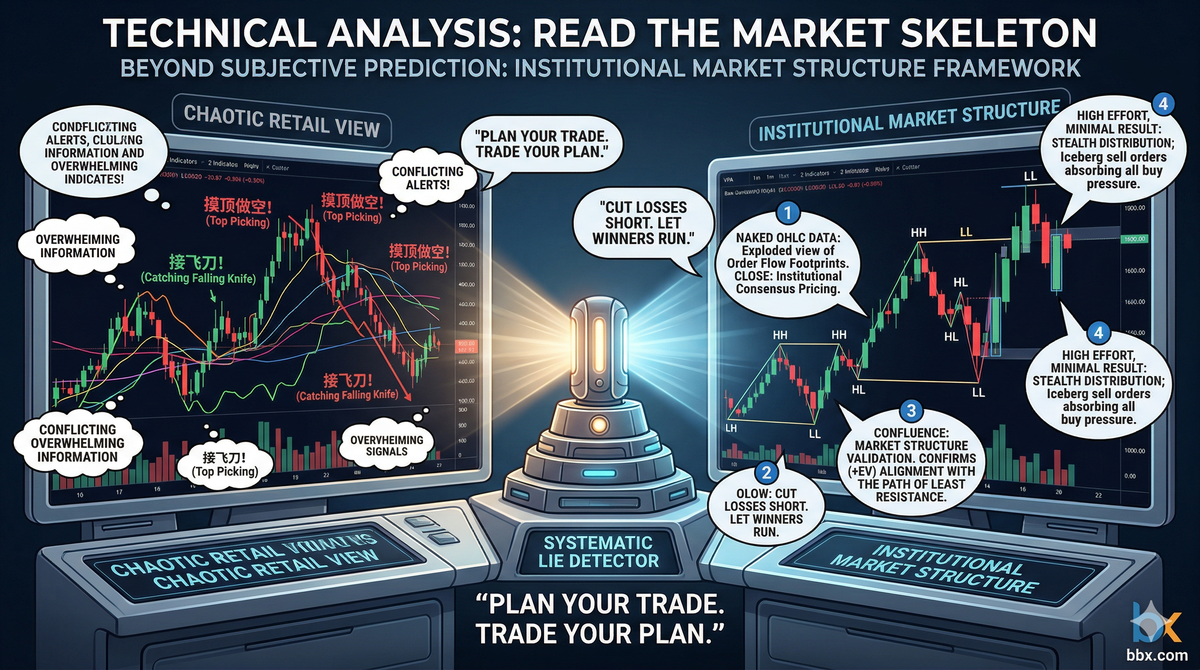
Elite proprietary traders never play this dangerous coin-flipping game of picking tops and bottoms. They understand that trends possess immense physical inertia. To achieve long-term Positive Expected Value (+EV) in this market, you must completely abandon subjective forecasting and learn to read the market's foundational skeleton: Market Structure.
I. The Geometry of Order Flow: Defining Trends with Objective Rules (HH, HL, LH, LL)
Discard your "gut feeling" for market direction and adopt the unambiguous, geometric definitions utilized by Wall Street's quantitative algorithms. At a micro-level, any complex chart pattern can be deconstructed into a series of critical Swing Highs and Swing Lows.
1. Bullish Market Structure
An algorithm will only validate a healthy bullish trend if the price chart strictly and sequentially prints the following structure:
- Higher High (HH)
- Higher Low (HL)
The Institutional Lens: Every time a new HH is established, it signifies that buyer Momentum is exceptionally strong, actively sweeping Sell-side Liquidity to the upside. Conversely, the HL formed during a pullback acts as the institutional "moat"—as long as this HL is not breached, the underlying bullish Order Flow logic remains absolutely secure.
2. Bearish Market Structure
Similarly, a market dominated by sellers is structured by the following sequence:
- Lower High (LH)
- Lower Low (LL)
The Institutional Lens: Every LH formed during a bounce exposes a severe lack of bullish demand and heavy Supply Pressure overhead. As long as the previous LH is not breached, any ferocious-looking rally must be classified merely as a "Dead Cat Bounce." Selling the rips remains the only mathematically sound strategy.
II. The Market's Breathing Rhythm: Impulses, Corrections, and the Premium/Discount Matrix
Understanding structure is only half the battle; you must also master the rhythm of institutional accumulation. Regardless of whether the trend is bullish or bearish, price never moves in a straight 90-degree line—it must "breathe" like a living organism.
- Impulsive Wave / Expansion (Exhalation): The leg of price action moving in the direction of the primary trend. It is characterized by extreme velocity, full-bodied candlesticks (large bullish/bearish bars), and a surge in volume. This is the result of Smart Money actively attacking the order book and driving a price revaluation.
- Corrective Wave / Retracement (Inhalation): The leg moving counter to the primary trend. It typically exhibits sluggish momentum, overlapping and choppy candlesticks, and significantly contracting volume. This represents partial profit-taking and the market naturally digesting supply.
[Core SMC Secret: Premium and Discount Arrays] Institutions never chase price at the exhaustion point of an Impulsive Wave. They utilize the Fibonacci retracement tool, anchoring from the origin to the terminus of the recent impulse, to divide the price range:
- Premium Zone (Above the 50% Equilibrium): Price is expensive. In a bullish trend, institutions never buy here. In a bearish trend, this is the prime kill zone for initiating shorts.
- Discount Zone (Below the 50% Equilibrium, especially the 0.618 - 0.786 deep retracement levels): Price is cheap. High-win-rate professional traders will only wait for the Corrective Wave of a bullish trend to retrace into the "Discount Zone" before initiating long positions to capture the next explosive Impulsive Wave.
III. The Sole Objective Confirmation of a Reversal: MSS and ChoCh
We have repeatedly emphasized the danger of subjectively picking tops and bottoms. So, how do we definitively know when a trend has exhausted its momentum and is poised to reverse? The answer: We wait for the market itself to break its own geometric rules, issuing a definitive Market Structure Shift (MSS) or a Change of Character (ChoCh).
The Underlying Logic of a Trend Reversal:
- Trend Continuation (BOS - Break of Structure): In a bullish trend, as price continuously breaches previous highs (HH) to push upward, each successful breakout is termed a BOS, confirming the healthy continuation of the trend.
- Momentum Exhaustion (Failure to Swing): After a retracement, the price rallies but fails to print a new Higher High (HH), forming an equal or lower high. This is an early warning that bullish demand is drying up.
- Structural Breakdown (MSS / ChoCh): Subsequently, the price reverses downward and, with a highly destructive bearish candle, substantively breaches the critical "moat"—the previous Higher Low (HL).
In that precise moment, the bullish geometric defense line completely collapses. An MSS has officially occurred! On an objective mathematical level, this declares that sellers have seized control of the tape. At this juncture, you must not only ruthlessly liquidate all long positions, but you should also be preparing to flip short the moment the price bounces back into the "Premium Zone" for a retest.
Conclusion: Aligning with the "Path of Least Resistance"
At its core, market structure is the ultimate visual manifestation of capital flow, the long/short battle, and the hunt for liquidity.
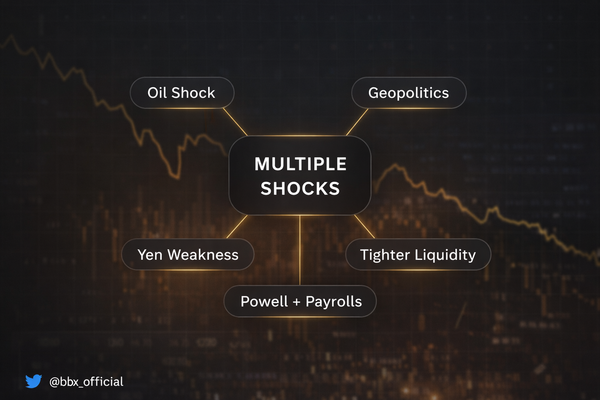
Do not be distracted by the cacophony of macroeconomic forecasts dominating financial media. All complex fundamental data and market sentiment are ultimately converted by real money execution into clear "Swing High / Swing Low" structures on the chart.
To follow the trend is to deploy your capital strictly along the "Path of Least Resistance" dictated by market structure. Learn to listen to the breathing rhythm of price. Patiently lie in wait when it "inhales" (retraces to the Discount Zone), and strike decisively when it "exhales" (expands into an Impulsive Wave). While the structure remains intact, grip your winning positions tightly; the moment the structure is violated (MSS), exit the market as ruthlessly as an algorithmic program. This is the Holy Grail of long-term compounding.
Disclaimer: This report is for informational purposes only and does not constitute financial advice.