Beyond the Valuation Trap: Reconstructing the Underlying Logic of Sector-Specific Fundamental Analysis
Why can't traditional P/E ratios price AI tech stocks? Why is high leverage the norm for banks? This guide deconstructs the underlying business logic and exclusive financial metrics of SaaS/AI, Retail, and Commercial Banking to help you build an institutional-grade sector analysis framework.
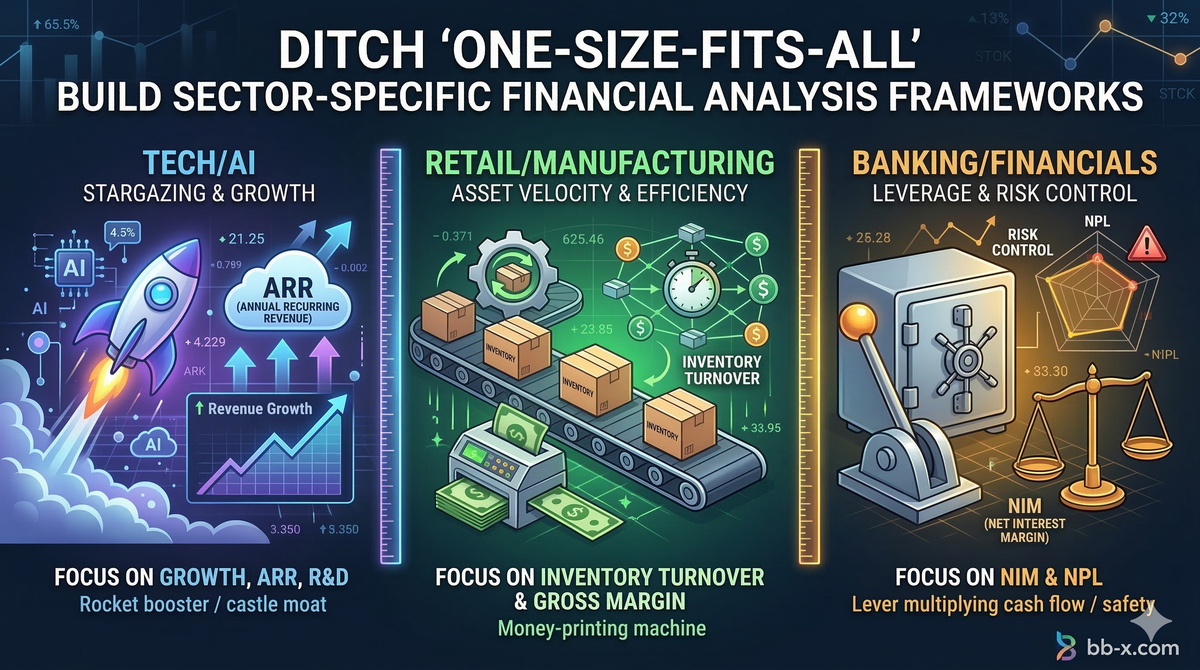
TL;DR (Core Summary): The core of asset pricing lies in the genetic differences of business models. In real-world trading, attempting to evaluate all industries with a universal set of financial metrics (such as relying solely on P/E or P/B ratios) is the root cause of beginners falling into the "valuation trap." To build an institutional-grade analytical framework, you must tailor your approach to the sector:Tech & SaaS (The Growth Premium): Traditional net income is a lagging indicator. The market prices these assets based on Top-Line Growth and Annual Recurring Revenue (ARR), focusing on the explosive marginal profitability once they cross the breakeven point.Retail & Manufacturing (Asset Turnover Driven): The core lies in Asset Operating Efficiency. Inventory Turnover and Same-Store Sales Growth (SSSG) are the absolute yardsticks for measuring supply chain moats and brand vitality.Financials & Banking (Leverage & Risk Pricing): As an industry defined by Highly Leveraged Operations, traditional debt-to-equity ratios fail here. Their profit foundation lies in the expansion of the Net Interest Margin (NIM), while their lifeline depends on risk control metrics like the Non-Performing Loan (NPL) Ratio.
Introduction: Breaking the "One-Size-Fits-All" Analytical Bias
In the early stages of fundamental analysis, investors are often obsessed with finding the "perfect" target: high net margins, low debt, and abundant free cash flow. However, if you mechanically apply this traditional value investing template, you likely would have perfectly missed out on Amazon, Tesla, and today's AI giants over the past decade, while potentially catching falling knives by buying into obsolete businesses known as Value Traps.
Why do the stock-picking criteria of Warren Buffett (traditional value) and Cathie Wood (disruptive innovation) seem worlds apart? Because the Business Models, CapEx Structures (Capital Expenditures), and Life Cycle Stages of different industries are fundamentally distinct.
Professional analysts would never evaluate Nvidia using Walmart's criteria, nor would they screen JPMorgan Chase using the debt standards of a manufacturing plant. Today, we will deeply deconstruct the exclusive fundamental yardsticks of three of the most representative sectors in the US stock market.
1. Software, Cloud Computing & AI: The "Growth Premium" of Intangible Assets
The financial hallmarks of tech stocks (especially SaaS, cloud computing, and AI model companies) are massive upfront R&D costs and extremely low marginal expansion costs. During their growth phase of aggressively capturing market share, astronomical R&D and marketing expenses severely erode current-period profits, often resulting in negative net income on the books. Therefore, using the Price-to-Earnings (P/E) ratio to value growth-stage tech stocks is entirely ineffective.
When institutional investors examine such assets, they anchor their analysis on three forward-looking metrics:
- Top-Line / Revenue Growth: This is the lifeline of a growth stock. Wall Street has an extremely high tolerance for tech companies—as long as they can maintain hyper-growth of 30% to 50% or more in revenue, the market is willing to pay a premium for their current losses (rewarding them with high Price-to-Sales or P/S multiples). If growth decelerates off a cliff, their valuation framework will suffer severe multiple compression.
- Annual Recurring Revenue (ARR): Unlike the one-time buyout model of traditional software, modern SaaS enterprises operate on a Subscription Model. A higher ARR means the company possesses a massive stream of Predictable Cash Flow and incredibly sticky customers, forming a deep Switching Costs Moat.
- LTV to CAC Ratio (Lifetime Value to Customer Acquisition Cost): The ultimate metric measuring a tech company's "cash-burn efficiency." If the cost to acquire a new customer (CAC) is significantly lower than the total gross profit that customer will generate over their lifespan (LTV), then near-term losses are simply "strategic investments."
2. Retail & Modern Manufacturing: Supply Chain Moats and "Asset Turnover Efficiency"
For traditional retail giants (like Costco or Walmart) or capital-intensive manufacturing, the business essence is the physical cycle of "procurement-processing-sales." In this arena, the time value of money is amplified to the extreme.
- Inventory Turnover Ratio: The lifeblood of the retail industry. The formula is
Cost of Goods Sold (COGS) ÷ Average Inventory.- Deep Dive: An exceptionally high inventory turnover ratio means the company can convert goods back into cash in a very short time, drastically elevating its Return on Invested Capital (ROIC). Stagnant inventory not only ties up massive working capital but also triggers fatal Impairment Losses. "Reasonable Gross Margins + Extreme Inventory Turnover" is the most powerful money-printing model in this sector.
- Same-Store Sales Growth (SSSG): The core metric for evaluating the true health of a chain business model. It strips out the mechanical revenue growth generated simply by opening new stores, reflecting the actual foot traffic and ticket size changes at mature, existing locations. A continuous decline in SSSG is often an early warning signal of decaying brand momentum.
3. Commercial Banking & Financials: Spread Arbitrage and "Credit Risk Pricing"
The balance sheet of the banking sector is fundamentally different from that of non-financial corporations. On a bank's ledger, depositor funds are Liabilities, while the loans it issues are its Assets. Therefore, banks are inherently entities of Highly Leveraged Operations, with debt-to-asset ratios typically hovering around 90%. Using traditional debt ratios to evaluate a bank is fundamentally flawed.
When analyzing financial stocks, you must focus on the core metrics of "Offense and Defense":
- Net Interest Margin (NIM) [The Profit Engine]: A bank's business model is built on Maturity Transformation—borrowing low-interest, short-term deposits and issuing high-interest, long-term loans. NIM measures the spread between the two. During a macro rate-hike cycle, banks with formidable deposit-gathering franchises will see their NIM expand significantly, driving massive surges in net profit.
- Non-Performing Loan Ratio (NPL) [The Risk Control Bottom Line]: Colloquially known as the bad debt ratio. A bank's profit margins are often thin, but its losses can wipe out the principal entirely. No matter how lucrative a bank's NIM is, if the quality of its underlying assets deteriorates (e.g., a wave of real estate defaults), surging NPL provisions will instantly devour all profits and could even breach its Tier 1 Capital Ratio, triggering a systemic bank run.
Investment Research Case Study: Cross-Sector Financial Validation
Let's test your institutional sector-thinking using three anonymized snippets of real corporate financial data:
| Financial & Operational Traits | Ticker Alpha (α) | Ticker Beta (β) | Ticker Gamma (γ) |
| Net Profit Performance | Recorded an $800M net loss | Stable profit of $2.5B | Record profit of $12B |
| Sector-Specific Catalyst | ARR surged 110% YoY | Inventory Turnover compressed to a staggering 11 days | NIM expanded by 50 bps; NPL sits at a mere 0.4% |
| Macro/Micro Risks | R&D accounts for 45% of revenue, straining cash flow | Macro weakness prolongs destocking cycle, pressuring margins with clearance discounts | Long-term yield curve inversion sparks credit tightening; SME default risk rising |
[BBX Research Analysis]:
- Ticker Alpha: A SaaS/AI Cloud provider in hyper-growth. Despite current net losses, the doubling of ARR indicates aggressive market capture and user mindshare dominance, justifying a high growth-stock valuation premium.
- Ticker Beta: A top-tier global retailer or smart manufacturing giant (e.g., Apple's supply chain echelon). An 11-day inventory turnover is a profound operational moat, proving that capital utilization efficiency has reached the industry's absolute pinnacle.
- Ticker Gamma: A systemically important, top-tier commercial bank. Steady NIM expansion coupled with rock-bottom NPL ratios demonstrates tremendous pricing power and superior credit risk management in a complex interest rate environment.
Disclaimer: This report is for informational purposes only and does not constitute financial advice.