Ditch the “One-Size-Fits-All” Metric! How to Analyze Financial Reports by Sector
Why do tech stocks with massive losses keep skyrocketing? Why do highly profitable bank stocks have such low P/E ratios? This guide will teach you to break free from the beginner's trap and master the core financial metrics for software/AI, retail/manufacturing, and the banking sector.
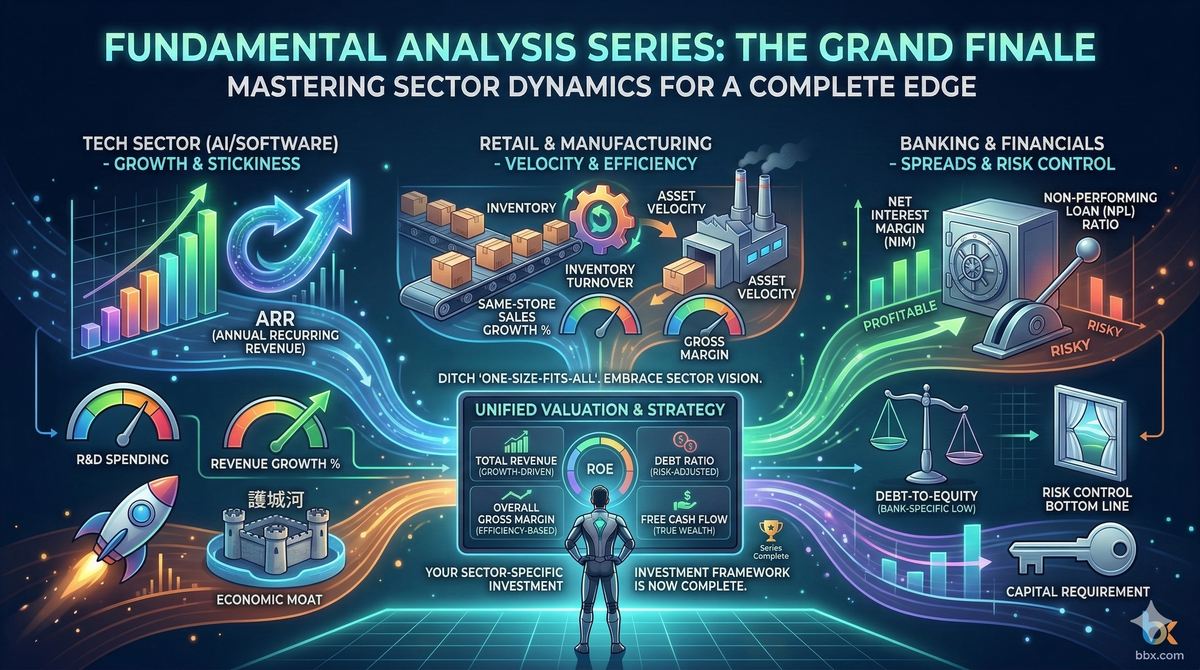
TL;DR (Quick Answer): Picking stocks is like dating; you can't evaluate a software engineer by the same criteria you'd use for a fitness coach. Different industries have vastly different business models, and their financial report analysis should reflect that:Software/AI Tech Stocks (The "Visionary" Type): Don't get hung up on near-term net income. Focus on Revenue Growth Rate, Annual Recurring Revenue (ARR), and R&D Investment. As long as growth is explosive, a company can be a great investment even while losing money.Retail/Manufacturing Stocks (The "Hustler" Type): Focus on Inventory Turnover and Gross Margin. Selling goods quickly is paramount; stale inventory sitting in a warehouse is the ultimate profit killer.Banking/Financial Stocks (The "Money-makes-Money" Type): They don't sell products; money is their product. Focus on Net Interest Margin (NIM) (the ability to generate a profit from lending) and the Non-Performing Loan (NPL) Ratio (the risk control bottom line).
Introduction: Why Are Buffett and Cathie Wood's Stock Picking Criteria So Different?
If you've just finished our first four articles, eagerly searching the US stock market for a "perfect" company with a high net profit, low debt, and high free cash flow, you're likely to find yourself only buying established giants like Coca-Cola or Procter & Gamble. While these are solid companies, you'll completely miss out on explosive stocks like Amazon, Tesla (in its hyper-growth phase), or the current AI leaders, which have appreciated by hundreds or thousands of percent over the past decade.
Why? Because the DNA of their business models is different. A traditional value investing yardstick cannot measure a tech stock in its hyper-growth phase. Conversely, applying a frenzied tech stock valuation method to a traditional bank stock is a guaranteed way to lose your shirt.
Today, we're giving you the "sector-specific keys" to unlocking the financial reports of the three most iconic industries in the US stock market.
1. Software/AI Tech Stocks: Looking at "The Sky is the Limit" (Core: Growth & Stickiness)
Tech stocks, particularly SaaS (Software-as-a-Service) and AI companies, face astronomical upfront development costs. They often need to aggressively "burn cash" to capture market share. Therefore, in the growth phase of a tech stock, focusing on "Net Income" is meaningless.
If you are evaluating an AI company, you must lock your eyes onto these three metrics:
- Revenue Growth Rate: The lifeline of a tech stock. A 10% annual growth is mediocre; look for companies growing 40% or more. As long as market share is exploding, Wall Street is willing to tolerate short-term losses.
- Annual Recurring Revenue (ARR): The ultimate "economic moat" for a software company. The old model was a one-time software purchase (e.g., buying a CD); now, it's a subscription model (e.g., paying $20/month for ChatGPT Plus). The higher the ARR, the more a company can count on a steady, predictable "river" of future cash flow.
- R&D (Research & Development) Expense Ratio: The company's ammunition depot. If an AI company dramatically slashes its R&D spending just to make its "Net Income" look good, it's a sign that it's on a path to being overtaken.
2. Retail & Manufacturing Stocks: Looking at "Asset Velocity" (Core: Efficiency & Turnover)
Let's return to a traditional business model like our "BBX Lemonade Stand" or a global giant like Walmart. Their business is straightforward: buy inventory, process/stock it, and sell it. For them, time is money.
- Inventory Turnover: This is the retail industry's lifeline! It's a measure of how quickly a company is selling through its inventory.
- Common-sense Understanding: Imagine you bought $100,000 worth of lemons. If you can sell all of them in 10天 and restock, your turnover is extremely high, and you're maximizing your capital efficiency (think Costco). If those lemons sit in the warehouse for 3 months, you've not only tied up your capital, but the lemons will spoil, turning into a massive loss. High Gross Margin + High Turnover = The Ultimate Money-Printing Machine.
- Same-Store Sales Growth Rate: A critical metric for evaluating the true health of a retail chain (e.g., Starbucks or McDonald's). If total revenue is increasing only because the company opened 100 new stores this year, while sales at existing, older stores are declining, it's a major red flag that the brand is losing popularity.
3. Banking & Financial Stocks: Looking at "Spreads & Risk Control" (Core: Leverage & Safety)
Bank financial reports are unique. A traditional company with a 90% debt-to-equity ratio would be on the verge of bankruptcy. However, a bank's natural debt-to-equity ratio is around 90%. This is because the money you deposit is, from an accounting perspective, a "liability" on the bank's books. A bank is, fundamentally, a business built on "leverage."
When evaluating a bank stock, focus your analysis on one offensive and one defensive metric:
- Net Interest Margin (NIM) [The Offensive Metric]: A bank's core business is to "borrow low (by paying low interest on deposits) and lend high (by charging high interest on loans)." NIM is the difference between what a bank pays out in interest and what it receives. When the Federal Reserve raises interest rates, a bank that can raise its loan rates significantly while keeping deposit rates low will see its NIM expand, and its profits will explode.
- Non-Performing Loan (NPL) Ratio [The Defensive Metric]: This is the "bad debt" ratio. What percentage of the loans that a bank has made are unlikely to be paid back? No matter how high a bank's NIM is, if its risk control is poor and its NPL ratio spikes, it can face a sudden liquidity crisis and even collapse (as seen in the 2023 Silicon Valley Bank crisis).
Interactive Case Study: What Industry Do These Companies Belong To?
Here are three snippets from financial reports. Apply your sector-specific thinking to determine which industry each company belongs to.
| Core Features | Company A | Company B | Company C |
| Net Profit Situation | Huge loss of $500 Million | Profit of $1 Billion | Profit of $5 Billion |
| Sector-Specific Highlight | ARR (Annual Recurring Revenue) up 80% year-over-year | Inventory Turnover is a remarkably fast 14 days | Net Interest Margin expanded; Non-Performing Loan ratio controlled below 0.5% |
| Major Risk | Astronomical R&D spending, causing cash flow strain | Facing inventory backlog, forcing aggressive discounts and promotions | Economic recession leading to a large number of small business defaults |
[BBX Expert Analysis]:
- Company A is a classic "Software/AI Tech Company." While currently losing money, its explosive 80% ARR growth rate indicates that it's rapidly capturing market share and building a sticky customer base, with massive potential for future profitability.
- Company B is an efficient "Retail/Manufacturing Company." An incredibly fast 14-day inventory turnover means its goods are practically flying off the shelves, signaling high capital efficiency and a strong business model (think Apple's supply chain or Walmart's operations).
- Company C is a solid "Commercial Banking Stock." Its profits are generated by interest rate spreads while it manages risk. This type of stock is highly sensitive to the macroeconomic environment and interest rate cycles.
Disclaimer: This report is for informational purposes only and does not constitute financial advice.