Don't Let the Numbers Scare You! A 3-Minute Guide to the "Big Three" Financial Statements
What are the three main financial statements? Learn how to read the Income Statement, Balance Sheet, and Cash Flow Statement using a simple lemonade stand analogy on bbx.com.
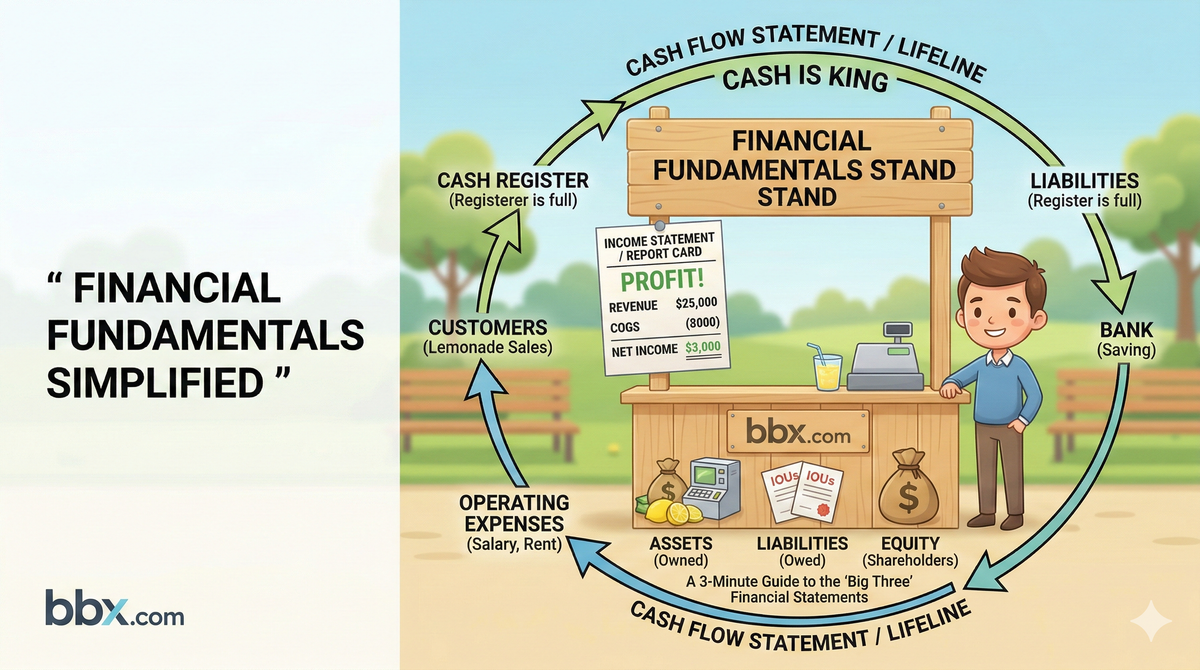
TL;DR (Quick Answer): Investing in a stock essentially means partnering up in a business. Whether it's Apple or Tesla, the core of any business can be simplified to running a local "Lemonade Stand." Reading an earnings report is simply looking at this stand's ledger. While Wall Street earnings reports can be hundreds of pages long, the core relies on the "Big Three" statements:The Income Statement: The "Report Card." It tells you if the lemonade stand made a profit or took a loss this year.The Balance Sheet: The "Foundation." It tells you what the stand owns, what it owes, and how thick its financial cushion is.The Cash Flow Statement: The "Lifeline." It tells you if the stand has enough cold, hard cash in the register to survive tomorrow.
Introduction: Why Must You Understand Financial Statements?
In our previous series, we mastered Technical Analysis tools like MACD and Candlestick patterns, which help you answer the question of "When to buy (Market Timing)." However, if you buy into a fundamentally flawed, heavily indebted company that is cooking its books, no technical indicator in the world can save you from a crash.
Fundamental Analysis solves the question of "What to buy (Stock Selection)." Financial statements are the ultimate medical check-up for a company. Do not be intimidated by the dense rows of numbers. Once you grasp the core logic, you can instantly tell if a company is building a real business or just telling a fairy tale to harvest retail investors.
To simplify the complex, whenever you analyze a publicly traded company from now on, just imagine it as your neighborhood "BBX Lemonade Stand."
1. The Income Statement: The "Report Card"
This is the statement novice investors flock to first because it answers the most pressing question: Did this company make money this year?
The logic of the Income Statement is simply a process of continuous subtraction:
- Revenue (The Top Line): Your lemonade stand sold 100,000 cups of tea this year at $20 each. Your total Revenue is **$2,000,000**. This is the absolute ceiling of your business volume.
- Cost of Goods Sold (COGS): To make those 100,000 cups, you had to buy lemons, tea leaves, ice, and plastic cups. These direct costs amounted to $500,000.
- Gross Profit: Revenue minus COGS ($2M - $500K) leaves you with **$1,500,000**. The higher the Gross Margin, the more pricing power and "economic moat" your product has.
- Operating Expenses (OpEx): Beyond the lemons, you have to pay store rent, employee salaries, and marketing fees on food delivery apps. These operational overheads cost $1,000,000.
- Net Income (The Bottom Line): Gross Profit minus OpEx, after paying taxes and interest. The actual money left in your pocket is $500,000.
The Takeaway: The Income Statement measures profitability. Even if the Top Line (Revenue) looks massive, if the Bottom Line (Net Income) is negative, you are running a business that bleeds money with every cup sold.
2. The Balance Sheet: The "Foundation"
If the Income Statement is a video showing what happened over the entire year (dynamic flow), the Balance Sheet is a snapshot taking a picture of the company's financial health at one specific moment in time (static accumulation).
At the heart of the Balance Sheet lies the eternal accounting equation: Assets = Liabilities + Shareholders' Equity
Translated into our Lemonade Stand language: What You Own = What You Owe + What You Actually Keep.
- Assets (What you own): The cash in the register, the unused tea in the warehouse, the ice machine, and even the value of your brand trademark. These generate future economic value.
- Liabilities (What you owe): The $500,000 loan you took from the bank to open the store, or the $100,000 you owe your lemon supplier (Accounts Payable). These are obligations you must pay in the future.
- Shareholders' Equity (What belongs to the owners): If you sold all your assets today and paid off every single liability, the net value remaining is what truly belongs to you and the shareholders.
The Takeaway: The Balance Sheet is a "stress test." A company might have a high Net Income (a great Report Card), but if it relies on a mountain of Liabilities, it could face sudden bankruptcy if the industry cools down or banks cut off credit (a weak Foundation).
3. The Cash Flow Statement: The "Lifeline"
This is the statement professional investors value the most—and the one that is hardest to manipulate. It reveals a company's true "survival ability."
In the business world, "Profit" is just an accounting opinion, but "Cash" is a fact. (Cash is King!) Imagine your Lemonade Stand scores a massive $1,000,000 corporate catering order. On your Income Statement, you immediately record $1M in Revenue, netting a $300,000 accounting profit. The company looks like it's booming. However! That corporation tells you, "We pay on net-90 terms (we will pay you in 90 days)." Right now, you have received $0 in cash. You only hold an IOU ("Accounts Receivable"). Next week, you need to pay rent and employee salaries. Without real cash flowing in, your highly "profitable" stand will go bankrupt next week!
The Cash Flow Statement tracks the actual movement of hard cash, divided into three sections:
- Operating Cash Flow (OCF): Cash generated directly from selling lemonade. This is the core! It must be positive.
- Investing Cash Flow: Cash spent on buying a new ice machine or acquiring a competitor.
- Financing Cash Flow: Cash raised by borrowing from a bank, or cash paid out to shareholders as dividends.
The Takeaway: A company can survive for years operating at a loss as long as cash keeps flowing in (e.g., early-stage Amazon or Uber). But if the cash flow dries up, even a highly "profitable" company will collapse overnight.
4. Interactive Case Study: Which Stand Would You Invest In?
Let's do a real-world simulation. Assume we have two chain companies, Company A and Company B. Look at their core metrics from last year:
| Financial Metric | Company A (The Viral Expander) | Company B (The Steady Operator) |
| Revenue (Top Line) | $50 Million (100% Growth) | $20 Million (15% Growth) |
| Net Income (Bottom Line) | **$10 Million** | $5 Million |
| Debt Ratio (Foundation) | 85% (Highly Leveraged) | 30% (Debt-Free) |
| Operating Cash Flow (Lifeline) | -$2 Million (Cash Bleed) | +$8 Million (Cash Generator) |
If you were the investor, which company would you trust with your money?
[BBX Expert Analysis]: Novices are instantly seduced by Company A's "100% growth" and massive "$10M Net Income." But if you understand the "Big Three," you'll realize Company A is standing on the edge of a cliff. Despite its $10M accounting profit, its **Operating Cash Flow is negative (-$2M)!** This means the money it "made" from selling tea is entirely tied up in IOUs (receivables) or bloated inventory. Combined with a dangerously high 85% debt ratio, its cash chain will break the moment the market faces a headwind. Conversely, Company B might be growing slower, but it is drowning in cash (converting $5M of profit into $8M of actual cash in the bank) and carries virtually no debt. This is the true "money-printing machine" that survives and thrives in the long run.
Disclaimer: This report is for informational purposes only and does not constitute financial advice.