Stop Using Live Capital as a Sandbox: Institutional "System Backtesting" and Positive Expected Value (+EV) Validation
You’ve mastered technical analysis and risk management, but does your system actually make money? Unverified strategies are just illusions. Learn how to use institutional quantitative thinking to conduct Backtesting and Forward Testing to discover true Positive Expected Value (+EV).
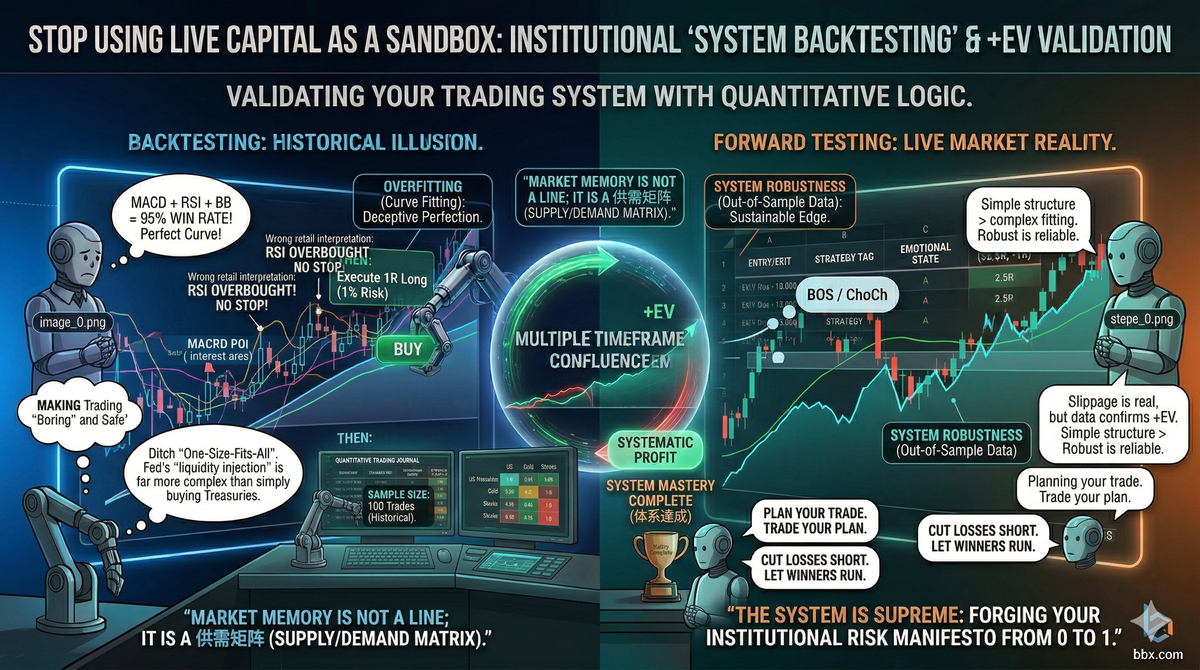
TL;DR (Core Summary): Any trading strategy that has not been rigorously validated by data is, fundamentally, just a beautiful illusion.The Core Purpose of Backtesting: It is not to prove how smart you are, but to objectively calculate your trading system's Positive Expected Value (+EV). Only when you see the mathematical certainty of winning over a large sample size can you maintain discipline during live drawdowns.Beware "Overfitting": Do not add endless complex filters to your system just to make historical data look flawless. "Holy Grail" indicators that look perfect in the past are usually the first to die in future live markets.Forward Testing: Backtesting is just theory on paper. Before deploying live capital, you must conduct real-time "Forward Testing" in a simulated environment to validate your execution fidelity and psychological resilience.
Introduction: Does Your Conviction Come From "Faith" or "Data"?
When you witness the price retesting a "Demand Zone" and printing a textbook "Bullish Engulfing" candlestick, do you have the absolute conviction to pull the trigger with a full 2% risk allocation without a second of hesitation?
If you hesitate, it indicates a severe lack of absolute trust in your trading system. For retail traders, "trust" often stems from a social media influencer's callout, or the "blind confidence" generated by accidentally making money on the last two trades. The moment they encounter three consecutive stop-outs, this fragile "faith" instantly collapses.
The reason institutional traders can pull the trigger like emotionless machines during extreme market volatility is that their conviction is rooted in cold, hard Historical Backtesting Data. They know precisely that this specific technical pattern has occurred 500 times over the last decade, yielding a 45% win rate and an average risk/reward ratio of 1:2.5. Therefore, when the 501st signal flashes, they feel no anxiety; they are simply executing mathematical probability.
Today, we will teach you how to build this unshakeable, data-driven confidence.
I. Manual Backtesting: Unearthing Your "Positive Expected Value (+EV)"
For independent traders without a programming background, manual backtesting is the fastest—and most grueling—shortcut to truly understanding the market.
The Standardized Backtesting Protocol:
- Define Absolute Rules: Your "5-Step Execution SOP" must be excruciatingly specific, leaving zero room for subjective ambiguity. (e.g., "I will only trade the 15-minute chart, only take trades aligned with the 4-hour macro trend, and only enter when the RSI is below 30 accompanied by a Pin Bar rejection.")
- Accumulate Sample Size: Utilize the "Bar Replay" feature on platforms like TradingView. Roll the chart back a year. Move forward candle by candle, hunting for setups that strictly meet your criteria. You must collect a minimum sample size of 100 complete trades.
- Log the "Black Box" Data: Treat this exactly like your live Trading Journal. Record the initial risk (1R), the final outcome (R-Multiple), and the duration of the trade for all 100 simulated setups.
Calculating Expected Value (EV): Formula: EV = (Win Rate × Average Win) - (Loss Rate × Average Loss) Assume you backtested 100 trades. You won 40 trades (40% Win Rate) with an average win of 3R. You lost 60 trades (60% Loss Rate) with an average loss of 1R. EV = (40% × 3R) - (60% × 1R) = 1.2R - 0.6R = +0.6R Conclusion: This system possesses a phenomenal Positive Expected Value (+EV)! Mathematically, every time a signal appears, you have essentially already made 0.6R. Armed with this statistical backing, will you panic when you suffer 5 consecutive losses in live trading? Absolutely not.
II. The Invisible Wall Street Trap: Overfitting
When backtesting, the most fatal mistake retail traders make is obsessively chasing the "perfect equity curve."
If you discover a strategy has only a 40% win rate, your instinct might be: "What if I add a MACD golden cross filter to boost the win rate? What if I add a Bollinger Band breakout so I never lose?" Consequently, you stack indicator after indicator. Eventually, you Frankenstein together a "money-printing machine" that boasts a 95% win rate over the past two years of historical data.
In the quantitative realm, this is known as Overfitting (or Curve Fitting). You are simply using hindsight bias to mistake historical market noise for a reliable edge. Because your filters are hyper-strict and custom-tailored only to past events, the moment this system encounters the randomness of Out-of-Sample Data (the future), its logic will entirely collapse, leading to catastrophic losses.
The Institutional Maxim: Elite trading systems are usually simple and highly Robust (meaning they are resilient against market noise). It is vastly superior to accept a simple, logically sound system with a 45% win rate than to deploy a hyper-complex, heavily curve-fitted system boasting a 90% win rate.
III. The Final Bridge to Live Trading: Forward Testing
If your backtest looks flawless, does that mean you can instantly deploy your entire net worth? Absolutely not.
Historical backtesting has three major blind spots:
- You cannot simulate intraday chop: Replaying candles skips the agonizing 8-hour wait and the psychological torture of volatile price action.
- No slippage or spreads: In a backtest, you always get filled at the perfect, ideal price. In live markets, lack of liquidity might prevent your order from filling entirely.
- No psychological pressure: Losing fake money in a backtest is a numbers game; losing real cash in a live market induces visceral pain.
The Solution: Forward Testing (Paper Trading). Take your newly backtested system into a real-time simulated environment (paper trading), or open a micro-account with negligible capital that you don't mind losing. Run the system strictly in live market conditions for at least 2 to 3 months, or until you accumulate 50 live trades.
If, during Forward Testing, your win rate and R-Multiple maintain Statistical Consistency with your historical backtesting data, congratulations—you have finally forged a lethal, battle-ready weapon.
Conclusion: Doing the Hard but Right Thing
In a market saturated with "get-rich-quick myths" and "secret trading indicators," spending weeks monotonously replaying candlestick charts and logging data in Excel is an intensely "anti-human" task. 99% of retail traders cannot endure even 20 backtested trades before impatiently rushing into the casino with live capital.
But remember: The financial markets never reward laziness. When you are willing to sit down, use quantitative logic to validate every entry protocol, and utilize large sample data to smooth out your psychological volatility, you have officially graduated from being "dumb money." Starting today, stop asking others "Is this strategy accurate?" Ask your backtesting data, and let the data become your only religion.
Disclaimer: This report is for informational purposes only and does not constitute financial advice.