Stripping Away Lagging Indicators: An Institutional Guide to Price Action and Liquidity Dynamics
Abandon your blind reliance on derivative indicators like MACD and RSI. This guide deconstructs institutional "Price Action," showing you how to read OHLC data and candlestick wicks to uncover the underlying truths of Order Flow and Liquidity.
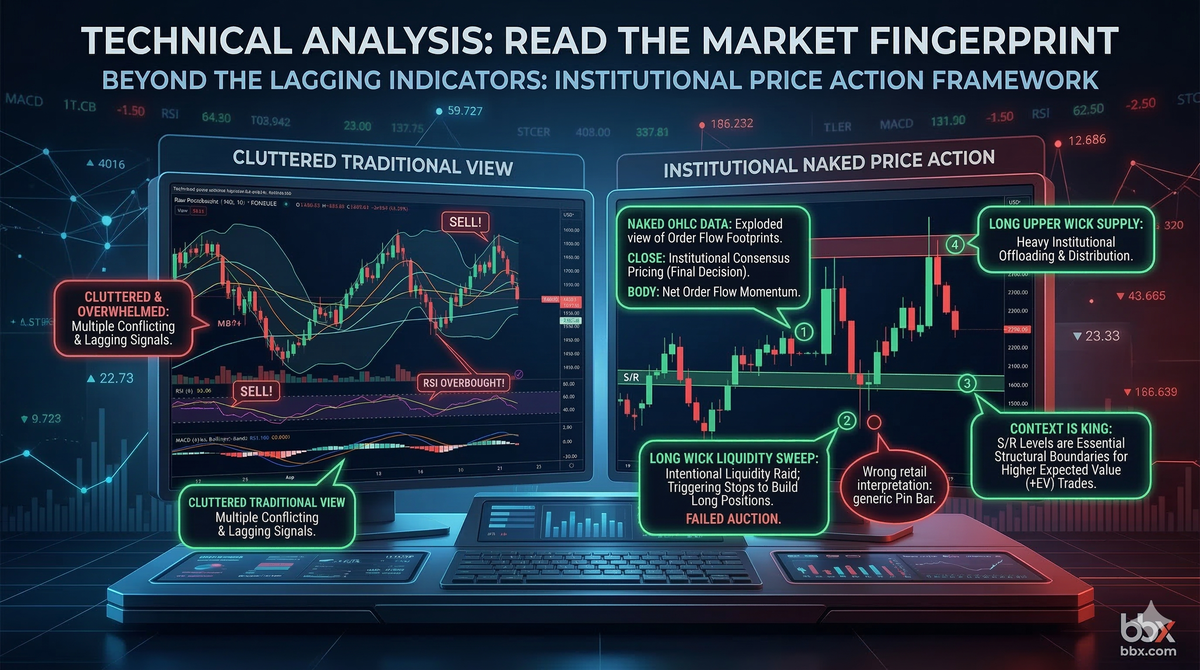
TL;DR (Core Summary): Any traditional technical indicator based on mathematical formulas (e.g., MACD, RSI, Bollinger Bands) is essentially a secondary smoothing of historical price data. By definition, they carry a fatal flaw: a Lagging Nature.Return to First Principles: The most primal and leading data source in the market is the price itself. Price Action is the absolute bedrock of all technical analysis.The Microstructure of Candlesticks: Candlesticks are not geometric shapes to be memorized; they are the Order Flow Footprints left by the battle between buyers and sellers. The Close Price represents the ultimate pricing consensus of institutional capital.Wicks as "Liquidity Rejection": Extremely long upper or lower wicks are viewed by institutions as a Liquidity Sweep. They indicate that the price encountered a severe Supply/Demand Imbalance when testing a specific zone, acting as a highly valuable precursor to a trend reversal.Context is King: Candlestick patterns divorced from Market Structure and key structural levels are meaningless noise. Where a pattern forms is infinitely more important than the pattern itself.
Introduction: Why Memorizing 100 Candlestick Patterns Still Leaves You as Exit Liquidity
In the early stages of learning technical analysis, countless retail traders treat it like a rote memorization exercise. "Morning Star," "Dark Cloud Cover," "Three White Soldiers"... These mystical-sounding terms not only fail to build a rigorous logical framework, but they often become deadly traps in live trading, inducing retail investors to act as exit liquidity for larger players.
Have you ever experienced this: You spot a textbook "Bullish Engulfing" pattern on the chart, go heavy on a long position, only to watch the price mercilessly break down the very next day?
The root cause is simple: A candlestick pattern stripped of its "Market Context" is statistically meaningless noise. True top-tier proprietary traders typically stare at screens displaying nothing but naked candlesticks and volume. Today, we will discard the retail "pattern recognition" approach and use an institutional Liquidity lens to dissect the true battle dynamics hidden behind a single candlestick.
I. The Anatomy of a Candlestick: The Power Dynamics of OHLC Data
A standard candlestick concentrates four absolute core data points within a specific timeframe: Open, High, Low, and Close (OHLC).
In the eyes of professional traders, the weight of these four data points in the Price Discovery Mechanism is vastly different:
- The Real Body & Unilateral Momentum: The solid body between the Open and Close represents the final direction of the Net Order Flow for that period. A full, large bullish or bearish candle indicates that one side has achieved an overwhelming Momentum advantage.
- The Open - The Venting of Emotion: Especially on a daily chart, the Open is often heavily distorted by overnight macro news and the impulsive market orders of retail traders, carrying an extremely high Whipsaw Risk.
- The Close - The Institutional Pricing Consensus: An ironclad rule on Wall Street is: "Amateurs open the market, professionals close it." The Close Price is the final settlement price that Smart Money is willing to accept after a full day of brutal long/short battles and high-frequency algorithmic warfare. Never front-run a trade based on intra-period floating patterns before the candlestick has officially closed.
II. The Wick Code: Failed Auctions and "Liquidity Rejection"
If we view the real body of a candlestick as the territory ultimately conquered by the warring factions, the upper and lower wicks (shadows) are the bloodstains left by intraday skirmishes. In the Price Action framework, a wick is essentially a Failed Auction.
1. The Long Lower Wick: The "Liquidity Sweep" at the Bottom
This occurs when the price violently crashes intraday (leaving a deep Low) but is subsequently forced back up by massive passive buying, ultimately converging near the highs to form a long lower wick (e.g., a Pin Bar).
- The Order Flow Perspective: This phenomenon typically occurs just below key support levels. Smart Money intentionally drives the price through support to trigger a cascade of retail Stop-Loss Orders (which are mathematically market sell orders). Institutions use this selling pressure as Liquidity to comfortably fill their massive long positions at wholesale prices. This is called "sweeping liquidity." Once absorbed, the price encounters fierce Buying Rejection and initiates a reversal.
2. The Long Upper Wick: Distribution at the "Supply Zone"
Conversely, when the price surges impulsively intraday but is hammered down by ferocious selling before the close, it leaves a very long upper wick.
- The Order Flow Perspective: This signifies that the price has tapped into a dense Distribution Zone filled with trapped longs or profit-taking supply. The bulls have exhausted their marginal purchasing power and are unable to absorb the incoming avalanche of sell orders. If this pattern appears at the tail end of a prolonged uptrend, it often indicates that Smart Money is using retail FOMO to Offload their inventory—an extremely dangerous topping signal.
III. Context is King: Location Dictates Expected Value
This is the most valuable underlying logic in all of naked candlestick trading: An identical candlestick pattern will yield drastically different Expected Value (EV) depending on where it appears in the market structure.
Suppose you observe an absolutely textbook "Bullish Pin Bar with a long lower wick":
- The High-EV Scenario (+EV): This candlestick perfectly retests a long-established Horizontal Support, a key moving average (like the 200 SMA), or a critical Fibonacci Retracement level. This creates Technical Confluence, indicating that Smart Money is aggressively defending the level. It is a highly robust entry trigger with an excellent win rate and risk/reward ratio.
- The Negative-EV Scenario (-EV): The price has been in a parabolic short-squeeze for weeks and is in deeply overbought territory. A so-called "long lower wick" appears during a high-level consolidation. There is a massive probability that institutions are simply using extreme intraday volatility to maintain the illusion of strength while quietly distributing their shares. Blindly chasing longs here turns you into the ultimate bag-holder.
The Ironclad Rule of Execution: Before analyzing any single candlestick, you must first Zoom Out, plot your macro Support/Resistance (S/R) Levels, and identify the current Market Structure. Technical patterns only possess actionable trading value when they interact with these core "battlefield boundaries."
Conclusion: Listening to the Market's Native Language
Abandon your superstitious obsession with colorful, lagging indicators. The golden crosses and death crosses of an MACD are fundamentally just calculus applied to past moving averages; they will forever be a step behind the front-line capital warfare.
The charts of true top-tier traders are often remarkably clean. By applying the philosophy of Price Action, they transform themselves into listeners of the market. Understanding the power transfer within the OHLC data, seeing through the liquidity raids hidden in the wicks, and waiting patiently for the lethal strike at critical structural levels—this is the ultimate mastery of technical analysis.
Disclaimer: This report is for informational purposes only and does not constitute financial advice.