What are Bollinger Bands? The Ultimate Volatility Channel for Explosive Breakouts
What are Bollinger Bands? They are the ultimate technical indicator for measuring market volatility. Learn how to trade breakouts, spot "The Squeeze," and use dynamic support and resistance on bbx.com.
TL;DR (Quick Answer):
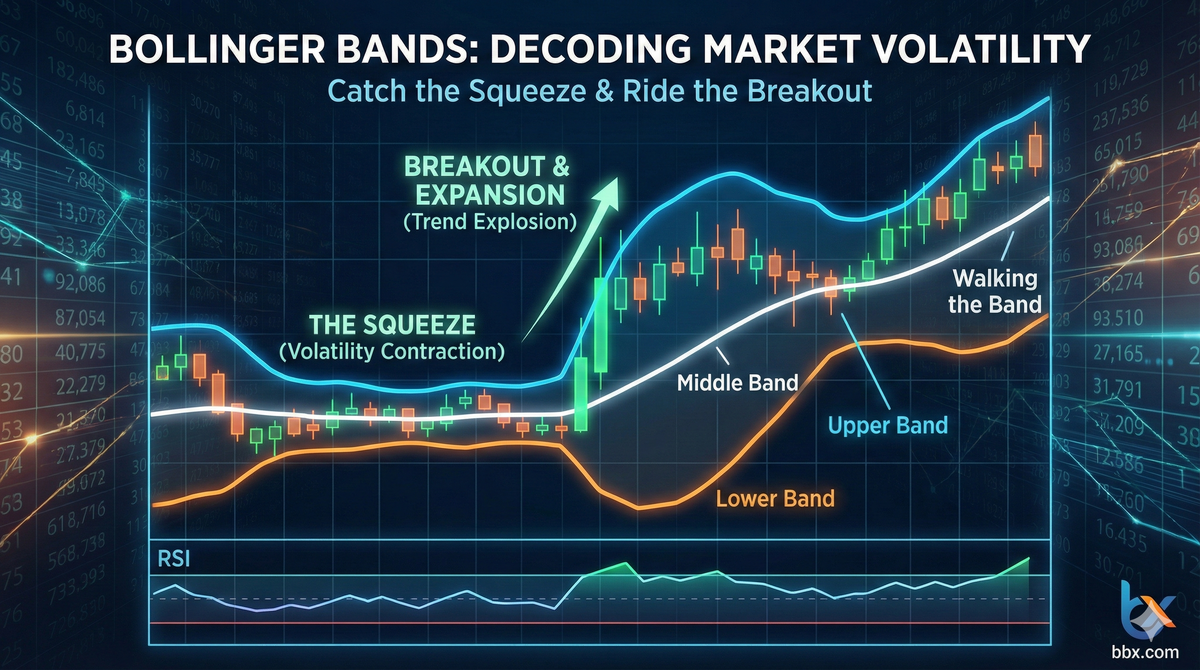
If the MACD measures "Trend" and the RSI measures "Momentum," then Bollinger Bands (BOLL) measure "Volatility." They plot a dynamic price envelope on your candlestick chart.The Core Trio: The Middle Band (SMA baseline), Upper Band (Dynamic Resistance), and Lower Band (Dynamic Support).The Statistical Iron Rule: No matter how erratic the market gets, price action will remain within this channel roughly 95% of the time.The Golden Playbook: When the bands violently contract (The Squeeze), it signals the "calm before the storm"—a massive directional breakout is imminent. In a choppy, trendless market, touching the upper band signals a short, while touching the lower band signals a long (Mean Reversion).
1. What are Bollinger Bands? Dynamic Guardrails for Runaway Prices
In the real trading world, markets spend roughly 70% of their time chopping sideways in a "ranging" state. During these periods, trend-following indicators like the MACD will constantly fire off false signals. Traders need a tool that adapts to the market's pulse—one that warns us when a dead market is about to explode, and tells us when a raging bull market is stretched to its absolute limit. Enter Bollinger Bands.
- Core Definition: Invented by legendary Wall Street trader John Bollinger in the 1980s, this indicator abandons rigid, static support and resistance lines. Instead, it creates a dynamic, elastic channel. The bands automatically widen (expand) when market volatility spikes and narrow (contract) when volatility dries up.
- The Highway Analogy: Think of Bollinger Bands as the elastic guardrails on a highway.
- The price is the car, and the Middle Band is the center lane marker. Under normal conditions, the car drives smoothly between the two guardrails (the Upper and Lower Bands).
- If the car violently crashes into a guardrail (price touches the outer bands), it indicates highly abnormal driving behavior. The physical laws of the market will often violently pull the car back to the center lane. This phenomenon is known as Mean Reversion.
2. The Math: Decoding the Statistics Behind the Bands
Bollinger Bands have stood the test of time on Wall Street because they are anchored in rigorous statistics—specifically, Normal Distribution and Standard Deviation ($\sigma$). The construction is elegantly simple, consisting of just three lines:
1. The Middle Band: The Axis of the Trend
This is typically a 20-period Simple Moving Average (SMA). It serves as the baseline and the center of gravitational pull for the channel.

2. The Upper Band: Dynamic Heavy Resistance
Calculated by taking the Middle Band and adding 2 times the standard deviation of the price. Statistically, the mean plus/minus two standard deviations captures approximately 95.4% of all data distribution.

3. The Lower Band: Dynamic Heavy Support
Calculated by taking the Middle Band and subtracting 2 times the standard deviation of the price.

The Core Takeaway: Whenever you see a candlestick pierce the Upper or Lower Band on your chart, you are witnessing an extreme 5% statistical anomaly. It means market emotion has reached a physical breaking point.
3. Practical Application: Mastering Bollinger Bands on bbx.com
When utilizing the charting tools on bbx.com, Bollinger Bands act as both a bottom-fishing net and an early warning radar for macro bull runs.
Tactic 1: Volatility Contraction & Breakouts (The Squeeze)
This is the most famous Bollinger Band setup, designed specifically to catch explosive, one-way trends.
- The Setup: When a market consolidates sideways for an extended period, the Upper and Lower bands compress tightly together. Volatility has frozen; bulls and bears are locked in a stalemate. This is the classic "calm before the storm."
- The Trigger: The moment a massive bullish (or bearish) candle forcefully breaks outside the Upper (or Lower) Band, accompanied by a rapid "Expansion" (the bands aggressively widening like a trumpet), a massive directional trend has begun. Traders should aggressively trade with the breakout momentum.
Tactic 2: Mean Reversion (The Bounce)
When the market lacks a clear macro trend and is stuck in a "choppy box," Bollinger Bands are the perfect grid-trading weapon.
- Buy Low, Sell High: When the price drops to the Lower Band and finds support, it is a short-term Buy/Long signal. When it rallies to the Upper Band and meets resistance, it is a short-term Sell/Short signal. The price will bounce back and forth like a ping-pong ball.
4. Advanced Tactics & Traps: Separating Pros from Amateurs
If you apply range-bound tactics to a trending market, Bollinger Bands will become a surefire way to liquidate your account.
The Rookie Trap: "Blindly Fading the Bands"
This is a bloody lesson learned by countless amateur traders. In a wildly aggressive, one-way bull market, the price will not only touch the Upper Band—it will passionately hug the Upper Band and continue to surge upward. In trading parlance, this is called "Walking the Band" or "Riding the Band."
In this scenario, touching the Upper Band is absolutely not a sell signal; it is a display of absolute dominance and a signal to buy and hold! If you blindly short the market here, the bullish stampede will crush your portfolio.
The Apex Defense: Confluence with the RSI
How do you know if touching the Upper Band means you should short (Mean Reversion) or buy more (Walking the Band)? Bring in the RSI indicator!
- The Top/Short Signal: Price touches the Upper Band, AND the RSI prints a clear "Bearish Divergence" (price makes a higher high, but RSI fails to follow). This shows the rally is running on fumes. Execute the short.
- The Continuation/Buy Signal: Price smashes through the Upper Band, AND the RSI surges upward alongside it (e.g., climbing healthily between 60-70 without severe divergence). This confirms explosive bullish momentum. Ride the band!
5. Frequently Asked Questions (FAQ)
Q: Should I change the default Bollinger Band settings (20, 2)?
A: John Bollinger himself highly recommends that the vast majority of traders stick to the default (20, 2)—a 20-period SMA with a 2-standard-deviation multiplier. You should only tweak the standard deviation if you alter the moving average period. For example: If you are scalping short-term and reduce the SMA to 10, drop the multiplier to 1.9. If you are swing trading long-term and increase the SMA to 50, raise the multiplier to 2.1.
Q: Why do cryptocurrency traders love Bollinger Bands so much?
A: Because crypto assets like Bitcoin exhibit insanely high volatility and frequent price extremes. Standard, static moving averages are easily pierced by institutional "liquidity wicks" (Darth Maul candles), leading to constant stop-loss hunting. Because Bollinger Bands are calculated using standard deviation, the channel auto-adapts to crypto's extreme volatility, effectively filtering out the noise and fake-outs.