What Are Candlestick Patterns? Mastering Price Action to Expose the Smart Money Playbook
What are candlestick patterns? Learn how to use Price Action, Pin Bars, and Engulfing patterns to decode Smart Money and spot market reversals on bbx.com.
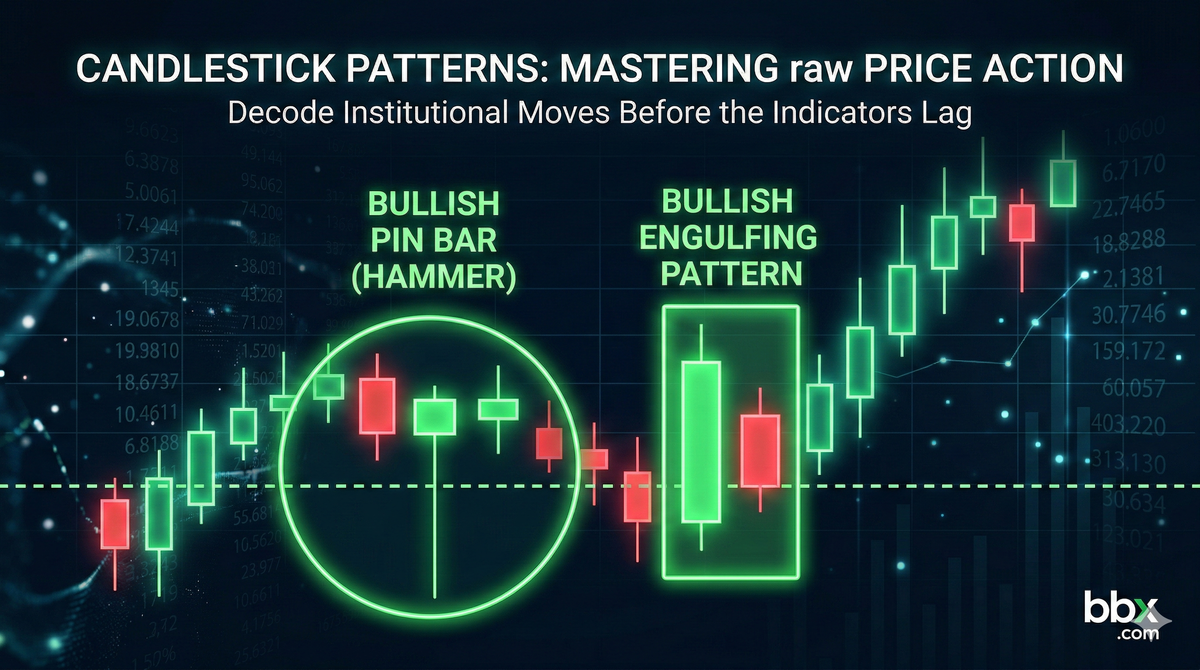
TL;DR (Quick Answer): The indicators we've studied so far—MACD, RSI, and Moving Averages—all share one fatal flaw: They are Lagging Indicators. If you want to spot institutional moves before the indicators fire off a signal, you must learn the rawest language of the market: Candlestick Patterns, widely known on Wall Street as Price Action Trading.The Anatomy: Open, High, Low, Close (OHLC). The Body represents the final outcome of the bull/bear battle, while the Wick (Shadow) reveals intra-period resistance and volatility.The Apex Reversal Patterns: > 1. The Hammer (Pin Bar): Features an exceptionally long lower wick, signaling that a plunge below support was aggressively bought up by institutions (Price Rejection). 2. The Engulfing Pattern: A massive candle body completely eclipses the previous smaller candle, signaling an explosive momentum shift and a total takeover by one side.The Golden Rule: Candlestick patterns traded in isolation will drain your account. Context is King. A reversal pattern is only a valid, tradable signal when it prints at a critical Support/Resistance level.
1. What is a Candlestick? The Market's "Electrocardiogram"
If you strip away all the colorful, lagging indicator lines from your trading software, the only absolute truth left on the chart is the raw footprint of price itself.
- The Origin: Invented in 18th-century Japan by a legendary rice merchant named Munehisa Homma, candlesticks were used to track and predict the price of rice. Today, they do more than track numbers; they map the greed, fear, hesitation, and conviction of every market participant in real-time.
- Deconstructing the Anatomy: A standard candlestick is built on four data points (OHLC):
- The Real Body: The thick section between the Open and Close. The larger the body, the greater the directional dominance. A massive green body (Bullish Candle) means buyers dominated from the opening bell to the close.
- The Wick (Shadow): The thin lines extending above and below the body, representing the High and Low. Wicks are the ultimate clues for hunting Smart Money shakeouts! A long upper wick means bulls charged higher but were violently crushed by sellers (heavy supply). A long lower wick means bears dumped the price, but aggressive buyers stepped in to absorb the panic (heavy demand).
2. The High-Win-Rate Apex 1: The Hammer / Pin Bar
Among all single-candle formations, the Hammer (frequently referred to in Western Price Action as the Pin Bar) is the undisputed favorite weapon for professional traders looking to catch market bottoms.
- The Visual Signature: It features a very small real body (often near the top or bottom of the entire candle) and an exaggeratedly long wick (the wick should be at least 2 to 3 times the length of the body).
- The Smart Money Playbook: Let's break down a Bullish Hammer (long lower wick) at market bottoms:
- The Panic Dump: The market opens, and bears aggressively slam the price down. Retail traders panic and blindly sell to cut losses.
- The Liquidity Sweep: As the price plunges below a key support level, it triggers a cascade of retail stop-loss orders. This is exactly what Smart Money (Institutions) wants. They step in, utilizing this retail panic as liquidity to silently accumulate massive long positions.
- The V-Shaped Reversal: This overwhelming institutional buying pressure forces the price all the way back up near the open before the session closes, leaving behind a massive lower wick.
- The Trading Signal: This is a textbook "Price Rejection." It screams that the floor is rock solid, bearish momentum is exhausted, and a vicious counter-rally is imminent.
3. The High-Win-Rate Apex 2: The Engulfing Pattern
If the Hammer is a "defensive counterattack," the Engulfing Pattern is a "knockout punch." Composed of two candlesticks, it represents an instant, undeniable reversal in market momentum.
- The Visual Signature: The real body of the second candlestick completely covers (engulfs) the real body of the first candlestick.
- The Smart Money Playbook: Let's look at a Bullish Engulfing setup:
- Lulling the Bears: Day 1 prints a sluggish, small red (bearish) candle. The bears seem to still be in control, and retail is convinced the downtrend will continue.
- The Nuclear Explosion: On Day 2, bulls suddenly hijack the market. Massive buy orders flood the exchange. The price surges relentlessly, and the closing price not only recovers all of yesterday's losses but blasts to a new high. Visually, a giant green candle completely "eats" yesterday's red candle.
- The Trading Signal: This indicates a 180-degree emotional reversal in record time. Institutional capital has officially grabbed the steering wheel. When a Bullish Engulfing prints at the bottom of a downtrend, it is one of the strongest confirmations of a macro reversal.
4. Advanced Tactics: Why Do You Keep Losing with Candlesticks? (Context is King)
Many novice traders memorize candlestick patterns and blindly buy every Hammer or chase every Engulfing candle they see. Consequently, their accounts get decimated. Why?
The Fatal Flaw: Trading in "No Man's Land"
Candlestick patterns hold absolutely zero magical properties on their own. If a pristine Hammer forms right in the middle of a chart—suspended in mid-air without touching any support or resistance—it is meaningless. It carries a sub-50% win rate and is nothing more than random intraday noise.
The Professional Playbook: Confluence is the Trigger
In Price Action trading, there is a golden rule: "The candlestick pattern is the trigger, but the Context is the sniper's scope." A high-probability trade requires the candlestick pattern to achieve "Confluence" with the technical indicators we covered in previous chapters:
- Pattern + Dynamic Support: That Hammer with the long lower wick? It must print exactly as it taps the 200-day Moving Average, or perfectly bounce off the Lower Bollinger Band.
- Pattern + Fuel: That aggressive Bullish Engulfing candle? The Trading Volume beneath it must be massive! An engulfing candle on low volume is likely a Smart Money fakeout.
- Pattern + Extreme Emotion: When that Hammer forms, your RSI indicator should be deep in the "Oversold" territory (below 30).
When location (Support), momentum (RSI), fuel (Volume), and the trigger (Price Action) all align perfectly—that is when professional traders strike with size!
5. Frequently Asked Questions (FAQ)
Q: If a Hammer candle has a red body (closing lower than it opened) but a huge lower wick, is it still a bullish signal?
A: Yes. When trading Pin Bars/Hammers, the length and direction of the wick are infinitely more important than the color of the body. As long as the lower wick is exceptionally long (at least 2x the body), it proves that ferocious buying pressure stepped in to reject lower prices. Even if the candle closes slightly red, it remains a highly potent bullish reversal signal.
Q: Are daily candlestick patterns more reliable than 15-minute patterns?
A: Absolutely. In price action trading, the higher the timeframe (Daily, Weekly), the exponentially more reliable the signal. To paint a Bullish Engulfing on a Daily chart, Smart Money must deploy hundreds of millions of dollars—it is incredibly expensive to fake. Conversely, a 15-minute candle can be easily distorted by a few random market orders, making it full of untradable noise. Beginners should stick to scanning for patterns on the 4-Hour or Daily timeframes.
Disclaimer: This report is for informational purposes only and does not constitute financial advice.