What is the MACD Indicator? Decoding the "King of Indicators" for Precision Trading
What is the MACD indicator? It is the ultimate tool for tracking trend and momentum. Learn how to use Moving Average Convergence Divergence to identify Golden Crosses, Divergence, and optimal entry points on bbx.com.
TL;DR (Quick Answer):
The MACD (Moving Average Convergence Divergence) is a trend-following momentum indicator. It calculates the difference between two Exponential Moving Averages (EMAs) of different speeds to determine the strength of a market trend and pinpoint potential reversal zones.The Core Trio: The MACD Line (Fast Line), the Signal Line (Slow Line), and the Histogram.The Golden Rule: When the Fast Line crosses above the Slow Line, it triggers a "Golden Cross" (Bullish Buy Signal). When it crosses below, it forms a "Death Cross" (Bearish Sell Signal).The Ultimate Value: If fundamental analysis tells you what to buy, the MACD tells you when to buy it.
1. What is the MACD? The Ultimate Market Radar
In the world of financial trading, a great company does not automatically equal a great stock. If you buy a fundamentally flawless company at its all-time high, you could suffer through years of stagnant capital. To solve the infamous "Market Timing" dilemma, Technical Analysis was born. Among the thousands of available tools, the MACD stands undisputed as the default staple on every trading platform, widely revered as the "King of Indicators."
- Core Definition: The MACD is essentially the market's speedometer. It illustrates the relationship between short-term and long-term price movements through Convergence (moving closer together) and Divergence (moving further apart).
- Why is it the King? Most technical indicators are heavily biased: Moving Averages (MA) only show the trend but severely lag, while the RSI excels at spotting overbought/oversold conditions but struggles with macro trends. The MACD elegantly marries Trend and Momentum. It doesn't just tell you whether you are in a bull or bear market; it warns you when the bulls are running out of breath.
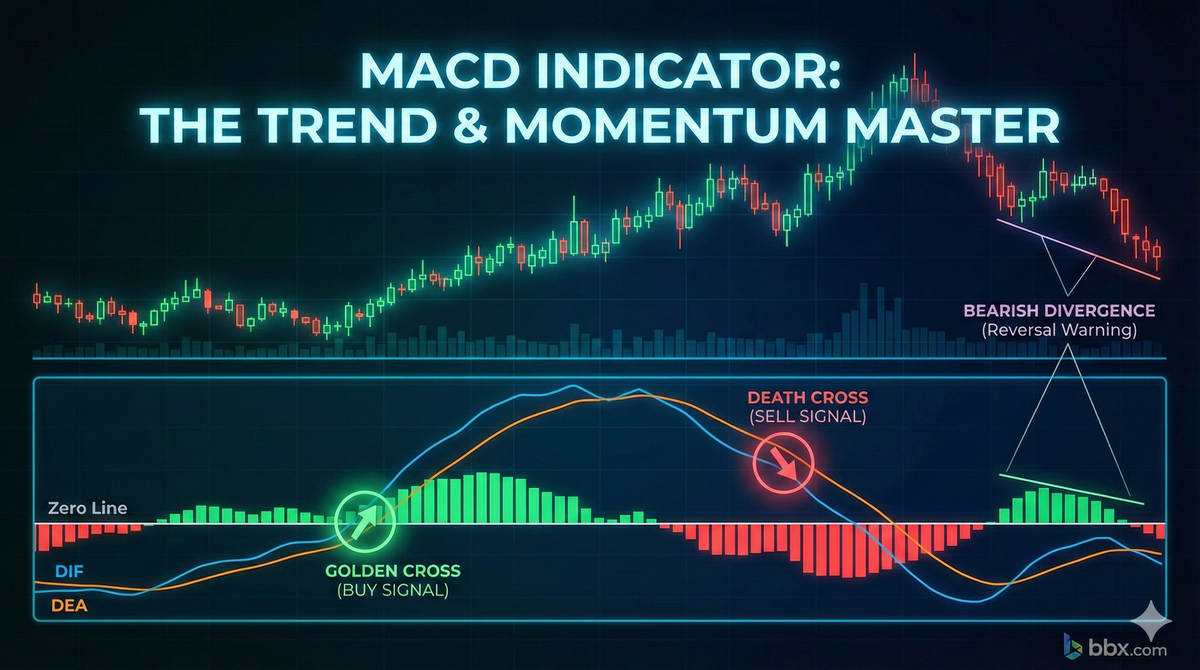
2. Anatomy of the MACD: Deconstructing the Engine
At first glance, the MACD panel might look like a tangled mess of spaghetti. However, stripping away its mathematical exterior reveals just three core components and a baseline.
The Mathematical Logic & Formulas
- The MACD Line (Fast Line / DIF): This line is hypersensitive to short-term price action. It is calculated by subtracting the 26-period EMA from the 12-period EMA.

- The Signal Line (Slow Line / DEA): This is a smoothed-out, lazier version of the MACD Line, used to confirm the trend and filter out market noise. It is standardly plotted as a 9-period EMA of the MACD Line itself.

- Expanding Red Bars: Bearish momentum is dominating; the sell-off is accelerating.
- The Zero Line (Centerline): The great divide. When the MACD operates above the Zero Line, the asset is in a macro Bull Market. Below the Zero Line, it is in a Bear Market.
Expanding Green Bars:
Bullish momentum is surging; the uptrend is accelerating.
The Histogram (Red/Green Bars): This visualizes the physical distance between the MACD Line and the Signal Line. The height of the bars represents the strength (momentum) of the bulls or the bears.

3. Practical Application: Finding Entries and Exits on bbx.com
When utilizing the advanced charting tools on bbx.com, mastering these two foundational setups will help you avoid 80% of amateur counter-trend mistakes.
Tactic 1: The Golden Cross vs. The Death Cross
This is the most universally recognized MACD trading signal.
- The Golden Cross (Buy Signal): Occurs when the Fast Line crosses up and over the Signal Line. This indicates that short-term momentum has overtaken long-term inertia—the bullish momentum is confirmed. If this crossover happens near or slightly above the Zero Line, its explosive upside potential is exponentially higher.
- The Death Cross (Sell Signal): Occurs when the Fast Line crosses down and under the Signal Line. It warns that short-term buying pressure has evaporated. This bearish momentum shift is a classic signal to take profits or initiate a short position.
Tactic 2: The Zero-Line Crossover
- Bullish Breakout: When both the Fast and Signal lines surge upward through the Zero Line, it is a robust signal that a long-term macro bull market has begun, driven by massive capital inflows.
- Bearish Breakdown: Plunging below the Zero Line signals a long, cold crypto or stock winter. During this phase, traders should remain largely in cash and absolutely avoid trying to "catch a falling knife."
4. Advanced Tactics & Traps: Separating Pros from Amateurs
If you are only trading basic crossovers, you are still trading like a novice. Institutional traders revere the MACD primarily for its "Divergence" setups.
The Ultimate Weapon: Divergence
Divergence occurs when the price action on the chart fundamentally disagrees with the trajectory of the MACD indicator. It is the ultimate leading indicator for epic trend reversals.
- Bearish Divergence (The Top-Finder): The stock price pushes higher to print a Higher High, but the MACD Line and Histogram fail to follow, printing a Lower High. This exposes the rally as a hollow facade—"smart money" is quietly distributing (selling) their shares into the strength. A violent crash is often imminent.
- Bullish Divergence (The Bottom-Catcher): The stock price bleeds out to print a Lower Low, but the MACD refuses to drop further, instead printing a Higher Low. This reveals that the selling pressure has been completely exhausted. The market is a coiled spring, ready for a vicious relief rally.
The Deadly Flaw: The "Whipsaw" Trap in Ranging Markets
Because the MACD is fundamentally a trend-following indicator, it harbors a fatal weakness: It completely breaks down in sideways, choppy markets.
When an asset's price consolidates in a tight, sideways range, the Fast and Signal lines will violently twist together like braided rope, constantly firing off fake Golden and Death Crosses. If you blindly trade these signals, you will get violently "Whipsawed" (chopped to pieces), bleeding out your account through constant small losses and trading fees.
- The Defense: Never use the MACD in isolation! In choppy markets, always pair it with Bollinger Bands or monitor Volume contraction to filter out the noise.
5. Frequently Asked Questions (FAQ)
Q: Should I change the default MACD settings (12, 26, 9)?
A: For 95% of traders, No. These are the golden parameters established by the MACD's creator, Gerald Appel, after decades of backtesting. More importantly, it is the most widely monitored setting across the entire financial industry. In Technical Analysis, "consensus creates power." Arbitrarily tweaking the parameters will pull you out of sync with the institutional algorithms, effectively neutralizing the indicator.
Q: Can I use the MACD as my sole trading trigger?
A: Absolutely not. Because it is built on Moving Averages, the MACD is inherently a Lagging Indicator. By the time a crossover confirms a trend, the initial explosive move has usually already occurred. To build a high-win-rate trading system, you must combine the MACD with Volume analysis, Support/Resistance zones, and the Fundamental Analysis metrics we covered in previous guides.