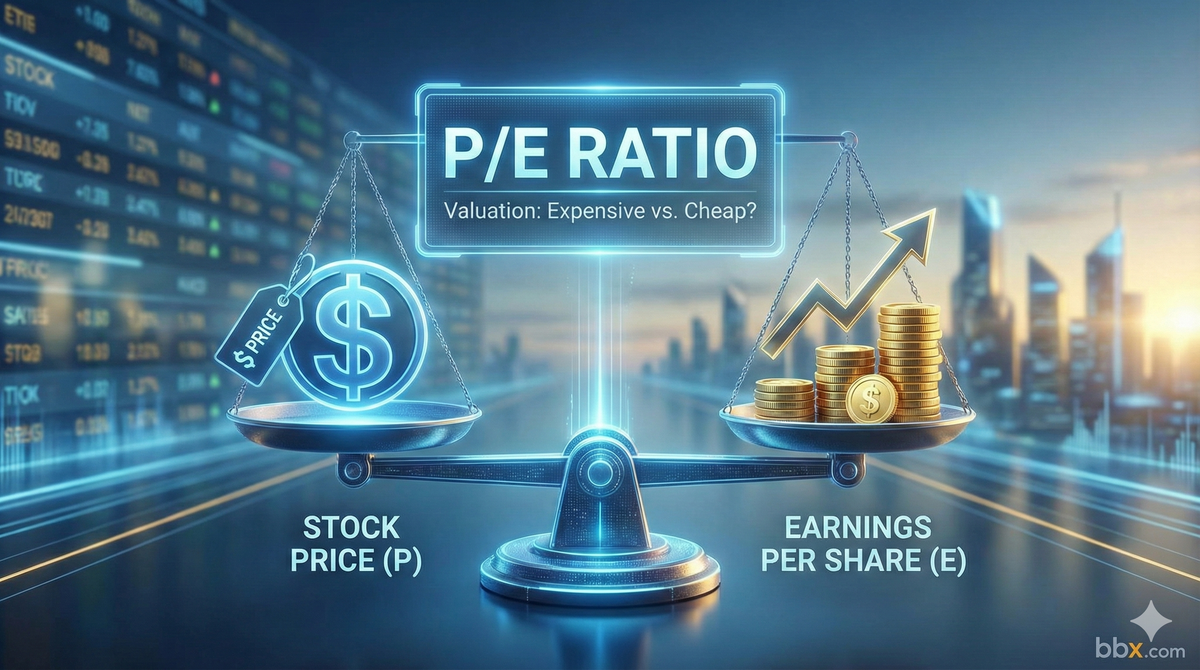
What is the P/E Ratio? The Ultimate Guide to Stock Valuation
Is a low P/E stock a bargain or a "Value Trap"? Don't invest blindly. Master the Price-to-Earnings Ratio to calculate the real payback period of your investment and avoid buying dying companies.
TL;DR (Quick Answer):
The Price-to-Earnings Ratio (P/E) measures a company's current share price relative to its per-share earnings. It tells you exactly how much investors are willing to pay for $1 of profit.The Core Concept: It represents the "Payback Period." A P/E of 20 implies that, assuming earnings remain constant, it would take 20 years for the company's profits to pay back your initial investment.
1. What is the P/E Ratio?
In the stock market, looking at the Price (P) in isolation is meaningless. A stock trading at $1,000 can be "cheaper" than a stock trading at $10, provided the former generates significantly more profit. The P/E Ratio is the universal standard for normalizing price against profitability.
- The Definition: It is the "price tag" of earnings. It reveals market sentiment—whether investors are optimistic (paying a premium) or pessimistic (demanding a discount) about a company's future.
- The "Golden Goose" Analogy:Imagine buying a goose that lays golden eggs.
- Price (P): The cost to buy the goose (e.g., $100).
- Earnings (E): The value of the eggs it lays per year (e.g., $5).
- P/E Ratio: $100 / $5 = 20.
- The Takeaway: At the current rate of production, it will take 20 years to break even. If you want a faster return, you must either negotiate a lower price (Lower P/E) or find a goose that lays more eggs (Earnings Growth).
2. The Math: Trailing vs. Forward
The formula is simple, but the input data determines the reliability of the result. On bbx.com, you will encounter two distinct types of P/E ratios:

A. Trailing P/E (TTM) —— The Reality Check
Calculated using the EPS from the last 12 months (Trailing Twelve Months).
- Pros: Based on actual, reported financial data. It is factual and objective.
- Cons: It is a "rear-view mirror." For high-growth companies, past earnings may vastly understate future potential, making the stock look artificially expensive.
B. Forward P/E —— The Crystal Ball
Calculated using analyst consensus estimates for future 12-month earnings.
- Pros: Forward-looking. It incorporates market expectations and growth projections.
- Cons: Estimates are often wrong. If analysts are overly optimistic, the Forward P/E will appear attractively low, luring investors into a potential trap if those earnings fail to materialize.
3. Practical Application: How to Interpret the Numbers
There is no "perfect" P/E number. A high P/E isn't always bad, and a low P/E isn't always good. Context is king.
Valuation Spectrum
| P/E Range | Market Sentiment | Typical Sectors | Investor Mindset |
| < 15 | Undervalued / Pessimistic | Banks, Energy, Utilities | Value Investing: The market sees low growth or high risk. Ideal for defensive investors seeking dividends. |
| 15 - 25 | Fair Value | S&P 500 Average | Core Holding: Represents the historical average for healthy, mature companies. |
| > 30 | Overvalued / Optimistic | Tech, AI, Biotech | Growth Investing: Investors are paying a premium for future explosion in profits. Beware of "Multiple Compression" if growth slows. |
| N/A | Loss-Making | Startups | Speculative: The company has no earnings. Valuation is based on sales (P/S) or user growth. |
The Two Rules of Comparison
- Peer Comparison (Apples to Apples): Never compare a Tech stock (e.g., Tesla, P/E 50) to a Retailer (e.g., Walmart, P/E 20). Compare Tesla to other EV makers.
- Historical Comparison (Time Travel): Check the stock's own 5-year average P/E. If it is currently trading significantly below its historical average, it might be a buying opportunity.
4. Risks: The "Value Trap" & Other Pitfalls
Novice investors often fall for the "Low P/E Fallacy"—buying a stock simply because the ratio is low. This is dangerous.
- The Cyclical Trap:For cyclical industries like Shipping, Mining, or Semiconductors, a low P/E is often a Sell signal.
- Why? A P/E of 5x usually occurs at the peak of the business cycle when earnings are abnormally high. As the cycle turns, earnings collapse, and the P/E spikes just as the stock price crashes.
- One-Time Gains (Distorted Earnings):If a company sells a factory for a massive profit, its Net Income spikes, temporarily crushing the P/E ratio. This makes the stock look cheap, but the earnings power is not sustainable. Always look at Adjusted P/E.
- Growth Ignored (The PEG Solution):Company A trades at 10x P/E (0% growth). Company B trades at 20x P/E (50% growth).Company B is actually "cheaper" when adjusted for growth. This is where the PEG Ratio comes in.
5. Frequently Asked Questions (FAQ)
Q: Can a company have a negative P/E?
A: No. If EPS is negative (the company is losing money), the P/E is mathematically undefined (N/A). In this case, investors rely on the Price-to-Sales (P/S) ratio to value the business.
Q: What is the PEG Ratio?
A: The PEG (Price/Earnings-to-Growth) Ratio refines the P/E by factoring in the expected growth rate.

- PEG < 1.0: Generally considered Undervalued (Growth at a reasonable price).
- PEG > 2.0: Considered Overvalued.
Q: What is a "reasonable" P/E Ratio?
A: Historically, the S&P 500 averages a P/E between 15x and 20x. A market-wide P/E above 25x often signals a bubble, while a P/E below 15x suggests a historical buying bottom.
Explore the Future of RWA with BBX Trade US/HK equities directly with stablecoins.
website: https://bbx.com/
X: https://x.com/bbx_official
Telegram: https://t.me/bbxcommunity
Discord: https://discord.com/invite/TAypgax4v9