What is the PEG Ratio? The Ultimate Weapon to Decode Growth Stock Valuations
What is the PEG Ratio? It is the ultimate valuation metric for growth stocks. This guide explains the PEG formula, Peter Lynch's investing rules, and how to find undervalued compounders on bbx.com.
TL;DR (Quick Answer):
The Price/Earnings-to-Growth (PEG) Ratio is the evolved, smarter version of the traditional P/E ratio. It evaluates a stock's valuation while explicitly factoring in the company's expected earnings growth rate.
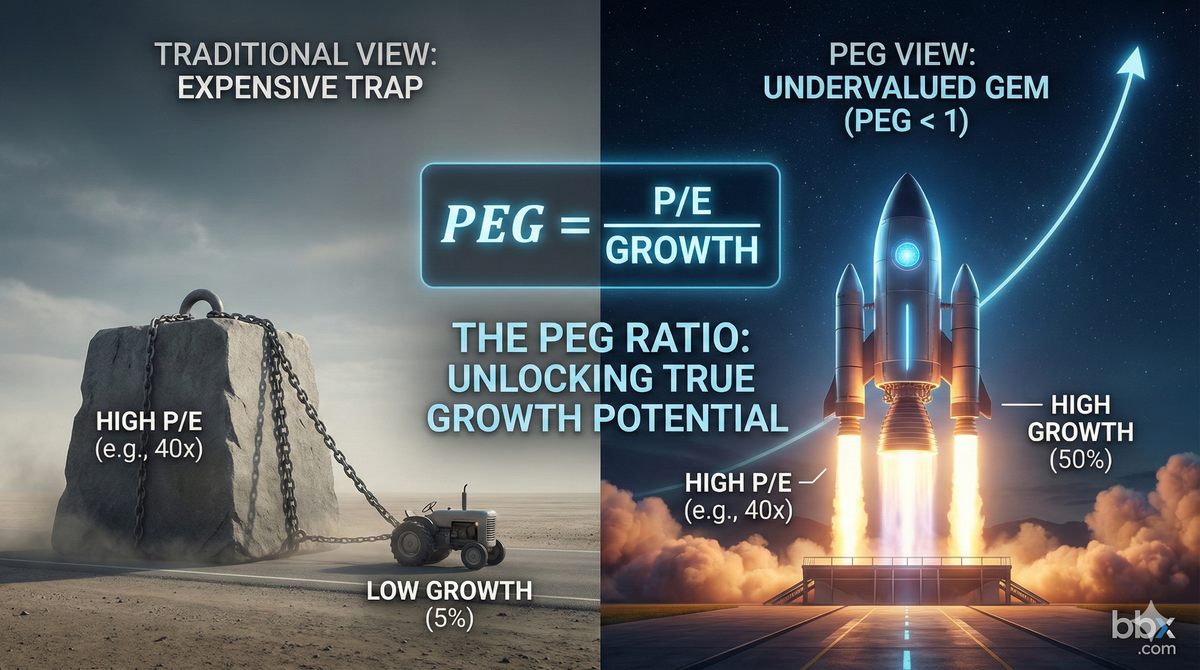
- The Core Formula:

- Peter Lynch's Golden Rule: When PEG < 1, the company's growth rate more than justifies its P/E multiple, signaling the stock is deeply undervalued. When PEG > 2, the growth cannot justify the premium price tag, signaling a potential bubble risk.
1. What is the PEG Ratio?
In fundamental analysis, the P/E Ratio is the most ubiquitous valuation metric. But it has one fatal flaw: it only looks at the present, ignoring the future. If you solely rely on P/E, explosive tech leaders like Nvidia or Amazon often boast ratios of 50x or even 100x. Traditional value investors might immediately dismiss them as "absurdly expensive," thereby completely missing out on generational wealth. The PEG Ratio was popularized to solve this exact historical dilemma: Is this high P/E stock actually a buy?
- Core Concept: It gives the P/E ratio "wings." If the P/E tells you how many years it takes to break even based on today's profits, the PEG tells you: If this company is accelerating, how much faster will you get your money back?
- The Restaurant Analogy: Imagine you are investing in two restaurant chains:
- Restaurant A (Low P/E): Valued at $10 million, generating $1 million a year ($P/E = 10x$). However, its market is saturated, resulting in 0% future growth.
- Restaurant B (High P/E): Valued at $40 million, generating $1 million a year ($P/E = 40x$). However, it just caught a massive new consumer trend, and profits are expected to grow by 50% annually.
- Looking only at P/E, Restaurant A seems cheap. But once you introduce the growth rate, Restaurant B's massive potential will quickly erase its early valuation premium. The PEG ratio is designed to help you identify Restaurant B.
2. The Math: How Cheap Can Be Expensive, and Expensive Can Be Cheap
To calculate PEG, you simply divide the company's P/E ratio by its expected Earnings Per Share (EPS) growth rate.
The Basic Formula

(Note: When calculating, drop the percentage sign. For example, a 20% growth rate is simply inputted as 20.)
A Practical Scenario
Let's compare two hypothetical companies on bbx.com:
- Company X (Traditional Manufacturing): P/E is 15x, expected annual growth is 5%.

- (Severely Overvalued)
- Company Y (Cutting-Edge Tech): P/E is 40x, expected annual growth is 50%.

- (Deeply Undervalued)
The Verdict: On the surface, Company X (P/E 15) looks "cheap," but because it lacks growth, you are actually paying a massive premium for a stagnant business. Conversely, Company Y (P/E 40) looks "expensive," but thanks to its blistering growth rate, it is actually a bargain offering a solid Margin of Safety.
3. Practical Application: Screening for Super-Compounders
Legendary Fidelity fund manager Peter Lynch is the most famous proponent of the PEG metric. When evaluating growth stocks, Wall Street generally relies on the following thresholds:
The PEG Valuation Scale
| PEG Value | Valuation Status | Investment Strategy |
| < 1.0 | Undervalued | Earnings growth outpaces the P/E multiple. This is Peter Lynch's ultimate "Buy Signal," often found in high-growth stocks that the market has temporarily mispriced. |
| 1.0 - 1.5 | Fair Value | In today's liquidity-rich market, dominant tech leaders with deep economic moats enjoy a "Certainty Premium." A PEG in this range is generally considered a reasonable entry point for elite companies. |
| > 2.0 | Overvalued | The stock price has front-run the company's future growth, or its growth is actively decelerating. If earnings miss the mark, the stock is highly vulnerable to violent Multiple Contraction. |
4. Risks & Traps: Wall Street's "Pie in the Sky"
No financial metric is flawless. If you use PEG without understanding its blind spots, you can easily become Wall Street's exit liquidity.
1. The Uncertainty of Forecasts (Garbage In, Garbage Out)
- The Trap: The denominator of the PEG ratio (Expected Growth Rate) is usually based on Wall Street analyst consensus. If analysts paint an overly rosy picture—forecasting an unrealistic 60% annual growth to help sell the stock—the resulting PEG will look incredibly seductive.
- The Fallout: If the company releases its earnings report and actual growth is only 20%, the denominator shrinks, causing the PEG to instantly spike. Disappointed investors will dump the stock, causing the P/E multiple to collapse simultaneously. This devastating one-two punch is known as the Davis Double Play.
- The Fix: Never blindly trust analyst forecasts. Cross-reference their estimates with the company's historical CAGR (Compound Annual Growth Rate) and Free Cash Flow (FCF) to ensure the growth is genuine.
2. The Base Year Trap
- The Trap: A struggling company finally turns a profit, going from earning 1 cent per share to 2 cents per share. Mathematically, that is a 100% growth rate! Plugging this into the formula creates a misleadingly low PEG.
- The Fix: The PEG ratio is absolutely useless for turnaround companies just breaking even, or for highly cyclical industries (like mining, shipping, or energy) where profits swing wildly from year to year.
5. Frequently Asked Questions (FAQ)
Q: Can I use the PEG ratio if a company's earnings are shrinking (negative growth)?
A: No. If the expected growth rate is negative, the resulting PEG will be negative, which has zero valuation meaning. For companies in secular decline or deep recessions, you must pivot to evaluating their P/B Ratio (Price-to-Book) or assessing balance sheet survivability.
Q: Why do many high-quality tech stocks currently have PEGs over 1.5? Are they still buys?
A: Peter Lynch's strict "PEG = 1" rule was formulated decades ago. In modern capital markets, absolute monopolies with extremely predictable cash flows (like Apple or Microsoft) are awarded a Certainty Premium by the market. Therefore, for apex predators with impenetrable economic moats, a PEG between 1.2 and 1.5 is often considered perfectly acceptable.
Q: Can I use PEG to value high-dividend stocks?
A: The standard PEG formula completely ignores dividend returns. If you are evaluating slow-growth, high-yield sectors like Utilities or Telecoms, you should use the upgraded PEGY Ratio (which adds the Dividend Yield to the Growth Rate in the denominator). Using standard PEG will severely undervalue exceptional dividend-paying stocks.
Explore the Future of RWA with BBX Trade US/HK equities directly with stablecoins.
website: https://bbx.com/
X: https://x.com/bbx_official
Telegram: https://t.me/bbxcommunity
Discord: https://discord.com/invite/TAypgax4v9