What is the RSI Indicator? The Ultimate Tool for Catching Bottoms and Spotting Tops
What is the RSI indicator? The Relative Strength Index is a key momentum oscillator. Learn how to identify overbought/oversold levels and spot divergences on bbx.com.
TL;DR (Quick Answer):
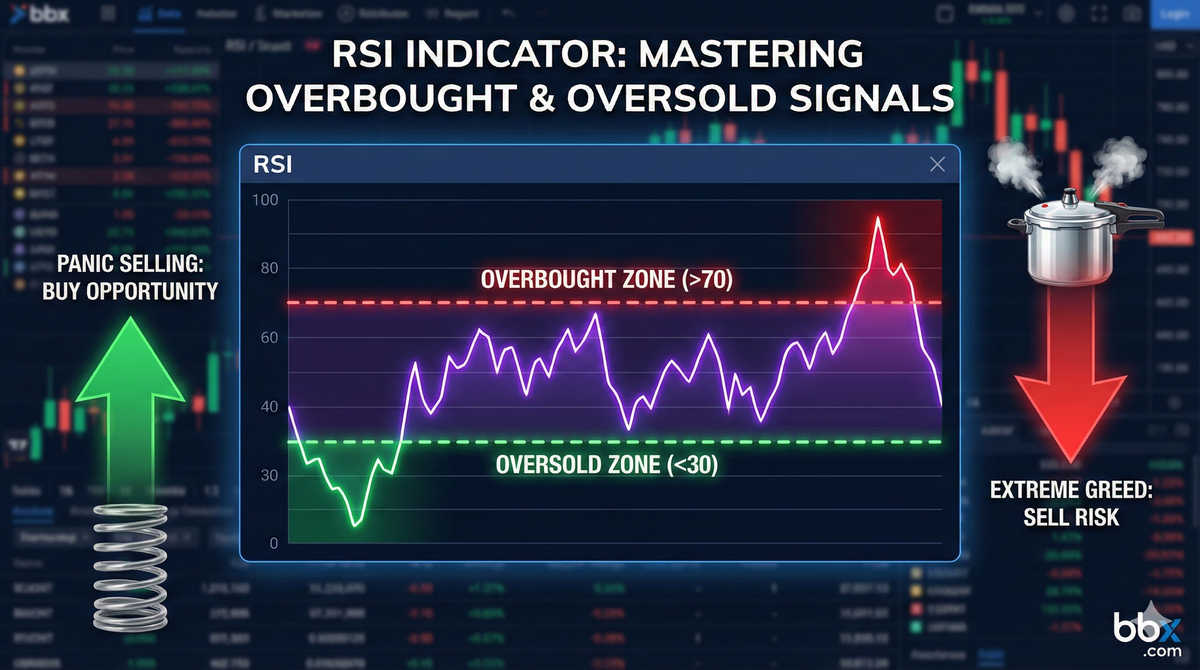
If the MACD helps you identify the "direction of the trend," the RSI (Relative Strength Index) helps you identify the "limits of market emotion." It is a Momentum Oscillator that measures the speed and magnitude of recent price changes.The Core Display: The RSI value constantly fluctuates on a scale from 0 to 100.The Golden Thresholds: 70 (Overbought Line) and 30 (Oversold Line).The Basic Rule of Thumb: When the RSI is > 70, the market is "Overbought" and vulnerable to a pullback. When the RSI is < 30, the market is "Oversold" and ripe for a potential bounce.
1. What is the RSI? The Market's Emotional Thermometer
In the trading world, human nature swings violently between extreme greed and extreme fear. When you watch a stock surge continuously for a week, you might feel the itch to chase the rally—but how do you know if you are just buying the local top? This is exactly when you deploy the Relative Strength Index (RSI).
- Core Definition: The RSI is essentially the market's emotional thermometer. By comparing the average gains on "up days" to the average losses on "down days" over a specific period, it mathematically quantifies whether the current market is irrationally exuberant or excessively pessimistic.
- The Physics Analogy: Think of market price action like stretching a coiled spring.
- As the price skyrockets, it's like pulling the spring upward with immense force. Once the RSI breaks above 70, the spring is stretched to its physical limit (Overbought). It is dangerously tense and ready to snap back violently (a price drop).
- Conversely, a relentless sell-off is like compressing the spring downward. Once the RSI drops below 30, it is compressed to its limit (Oversold). The selling pressure is exhausted, and the spring is primed to explosively decompress upward (a price bounce).
2. The Math & The Control Panel
On most trading platforms, the RSI appears as an independent sub-chart located beneath the main candlestick chart. It features a single momentum line oscillating between 0 and 100, bounded by two critical dashed lines: 70 (the ceiling) and 30 (the floor).
The Mathematical Logic
While you don't need to calculate this by hand (the advanced charting tools on bbx.com do it instantly), understanding the formula helps you decode the indicator's true nature:

- $RS$ (Relative Strength): This is the Average Gain divided by the Average Loss over a specified number of periods, $N$.
- The Default Parameter: The classic period $N$ established by Wall Street is 14 (i.e., the last 14 candlesticks).
- The Logic: If a stock closes higher every single day for 14 days, the Average Loss is zero, pushing the RSI to infinitely approach 100. If it closes lower every single day, the RSI approaches 0.
3. Practical Application: Nailing Entries and Exits on bbx.com
When utilizing the charts on bbx.com, mastering these two foundational tactics will drastically improve your short-term entry and exit precision.
Tactic 1: The Oversold Bounce (Buying the Dip)
When an asset suffers a panic sell-off, the RSI will swiftly plunge below 30, sometimes even touching 20. This indicates extreme market pessimism; the bears are running out of ammunition.
- The Optimal Entry: Do not blindly buy the moment it dips below 30! You should wait patiently. The highest probability short-term buy signal occurs when the RSI finds a floor and crosses back up through the 30 line. This confirms a reversal in momentum.
Tactic 2: The Overbought Rejection (Taking Profits)
When a stock is fueled by massive hype and surges vertically, the RSI will pierce the 70 level and might approach 85. This screams extreme FOMO (Fear Of Missing Out) as retail traders blindly pile in.
- The Optimal Exit: This is the zone where "Smart Money" begins to take profits. When the RSI peaks and crosses back down through the 70 line, it signals that the bullish momentum is fracturing. This is your cue to reduce your position or take profits.
4. Advanced Tactics & Traps: Separating Pros from Amateurs
Like all indicators, if you use the RSI mechanically, the market will punish you severely.
The Rookie Trap: "Overbought Can Stay Overbought"
This is the number one reason novice traders blow up their accounts using the RSI.
In a ferocious, unidirectional bull market, the RSI can become "embedded" above 70, staying there for weeks or even months. If you blindly short a stock simply because the RSI hits 71, you will be decimated by the trend.
- The Defense: In a strong trending market, never counter-trade the top. The RSI should only be used to find trend-following entries during brief pullbacks (e.g., buying when the RSI dips to 50 or temporarily touches 30).
The Apex Weapon: RSI Divergence
Just like the MACD, institutional traders look for Divergence as the ultimate RSI signal. When the price action fundamentally disagrees with the RSI momentum, an epic reversal is usually brewing.
- Bearish Divergence (The Top Warning): The stock price goes on a tear, printing a Higher High; however, the RSI looks exhausted, printing a Lower High. This reveals that the rally lacks genuine underlying strength. A severe correction is imminent.
- Bullish Divergence (The Bottom Signal): The stock price bleeds out, printing a Lower Low; but the RSI refuses to drop further, printing a Higher Low. This shows that the selling pressure has completely dried up. The market is a coiled spring ready for a violent relief rally.
5. Frequently Asked Questions (FAQ)
Q: What is the difference between RSI and MACD? Which one should I use?
A: They offer different perspectives and complement each other perfectly. The MACD excels at identifying macro trend shifts (based on moving averages, which lag). The RSI excels at pinpointing extreme emotional exhaustion (based on price magnitude, which is highly responsive). Professional traders use them in confluence: they use the MACD to confirm the broader trend, and the RSI to pinpoint hyper-accurate entries on shorter timeframes.
Q: Should I change the default 14-period setting on the RSI?
A: The creator, J. Welles Wilder, designed the 14-period default, which works perfectly for the vast majority of traders. However, if you are a Day Trader looking for hyper-sensitive signals, you might lower it to 9 or 7. If you are a Long-Term Investor, you might increase it to 21 to filter out daily market noise and focus on macro extremes.
Explore the Future of RWA with BBX Trade US/HK equities directly with stablecoins.
website: https://bbx.com/
X: https://x.com/bbx_official
Telegram: https://t.me/bbxcommunity
Discord: https://discord.com/invite/TAypgax4v9