What is the VIX Index? Finding the Profit Behind "Fear" in Market Turbulence
The VIX index is the core metric for measuring expected volatility in the US stock market. This guide explores the meaning of high/low VIX readings and how to avoid deadly traps in volatility products.
TL;DR: The VIX (CBOE Volatility Index) is the core gauge measuring the expected volatility of the US stock market over the next 30 days. It is calculated by tracking the options prices of the S&P 500. Simply put: A higher VIX means investors are more panicked; a lower VIX means market sentiment is more complacent.
1. What is the VIX Index? (What is it?)
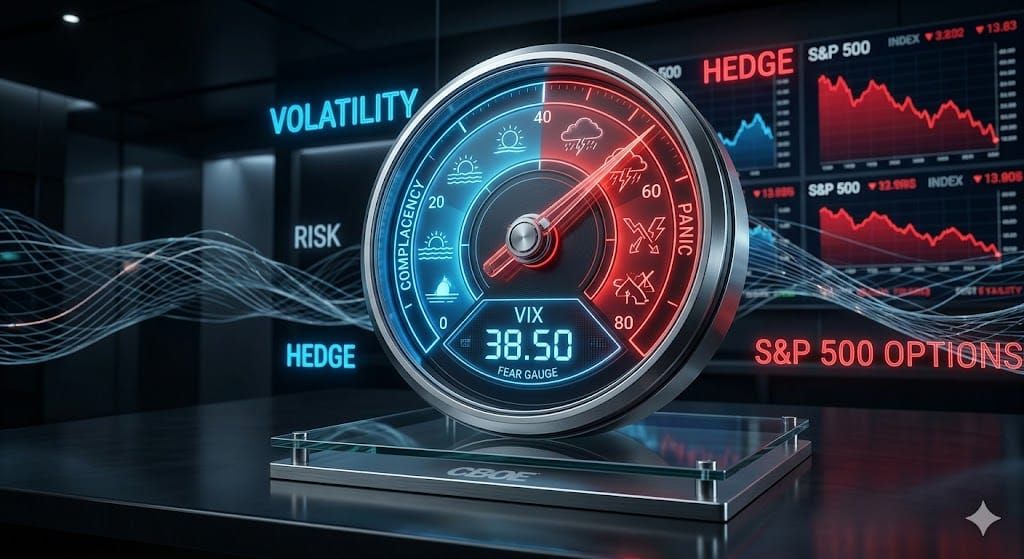
Introduced by the Chicago Board Options Exchange (CBOE) in 1993, the VIX is the most famous sentiment indicator in global financial markets, often referred to as the "Fear Gauge." When institutional investors worry about the future market, they heavily buy S&P 500 put options as a hedge. This buying frenzy drives up option prices, which directly causes the VIX to spike.
- Real-life analogy: Think of the VIX as the stock market's weather barometer. When the barometer is stable (VIX below 15), it's sunny and everyone is sunbathing on the deck. When it suddenly spikes (VIX breaking 30 or higher), it means a hurricane (sell-off) is coming, and everyone is frantically fighting for life jackets (put options).
2. How is the VIX Calculated? (The Core Logic)
Note: We've skipped the complex calculus here to focus on what matters to traders.
Instead of tracking a single option, the VIX aggregates a broad portfolio of call and put options on the S&P 500 index. It essentially measures the implied volatility based on the bid-ask spreads of these options, factoring in the time to expiration (standardized to 30 days) and the risk-free interest rate. Without getting bogged down in math, just remember: the VIX perfectly reflects the "premium" that institutions are willing to pay for portfolio insurance at any given moment.
3. Practical Application: How Should Investors Read It? (How to use)
Given the high volatility we've seen since early 2026, smart investors on platforms like bbx.com often treat the VIX as an excellent contrarian indicator:
- High Readings (> 30): Extreme Market Panic. There is a famous Wall Street saying: "When the VIX is high, it's time to buy." When the VIX surges past 30 or even 40, it often means retail irrational panic has peaked, and the market may soon present a "golden pit" for an oversold rebound.
- Low Readings (< 15): Extreme Greed and Complacency. "When the VIX is low, look out below." If the VIX stays low for an extended period, it indicates the market has let its guard down. Any sudden black swan event (like macro liquidity tightening) can easily trigger a stampede-style crash.
4. Common Pitfalls and Risks (Risks)
- Pitfall 1: Assuming the VIX predicts direction. The VIX measures the magnitude of volatility, not the absolute direction of the market. While it usually moves inversely to the stock market, during an extreme short squeeze or a melt-up, the VIX can actually rise alongside the S&P 500 due to surging options demand.
- Fatal Risk: Holding VIX derivatives long-term. Many beginners try to go long on panic by buying VIX ETFs (like VXX). However, you cannot buy the VIX index directly; you can only buy its futures. Because the futures market is usually in contango (futures prices are higher than the spot price), holding VIX products long-term results in severe "roll yield decay," which will slowly bleed your account dry.
5. Frequently Asked Questions (FAQ)
- Q: What is the difference between the VIX Index and the S&P 500 Index?
- A: The S&P 500 reflects the actual stock price performance of the 500 largest publicly traded companies in the US. The VIX measures investors' psychological expectations of the S&P 500's price fluctuation over the next 30 days. The former tracks price; the latter tracks sentiment.
- Q: What is considered a "good" VIX number?
- A: There is no absolute "good" or "bad." Generally, a range of 15 to 20 represents a healthy, mild state of volatility. A reading below 15 warns of over-optimism risks, while a reading above 30 suggests oversold opportunities born from extreme panic.
- Q: Why do stocks usually fall when the VIX rises?
- A: The stock market typically "takes the stairs up and the elevator down." During a slow uptrend, investors don't need emergency hedging, so options demand is low. During a sudden drop, institutions recklessly buy put options to protect their massive stock portfolios, driving up implied volatility and causing the VIX to spike.
Disclaimer: This report is for informational purposes only and does not constitute financial advice.