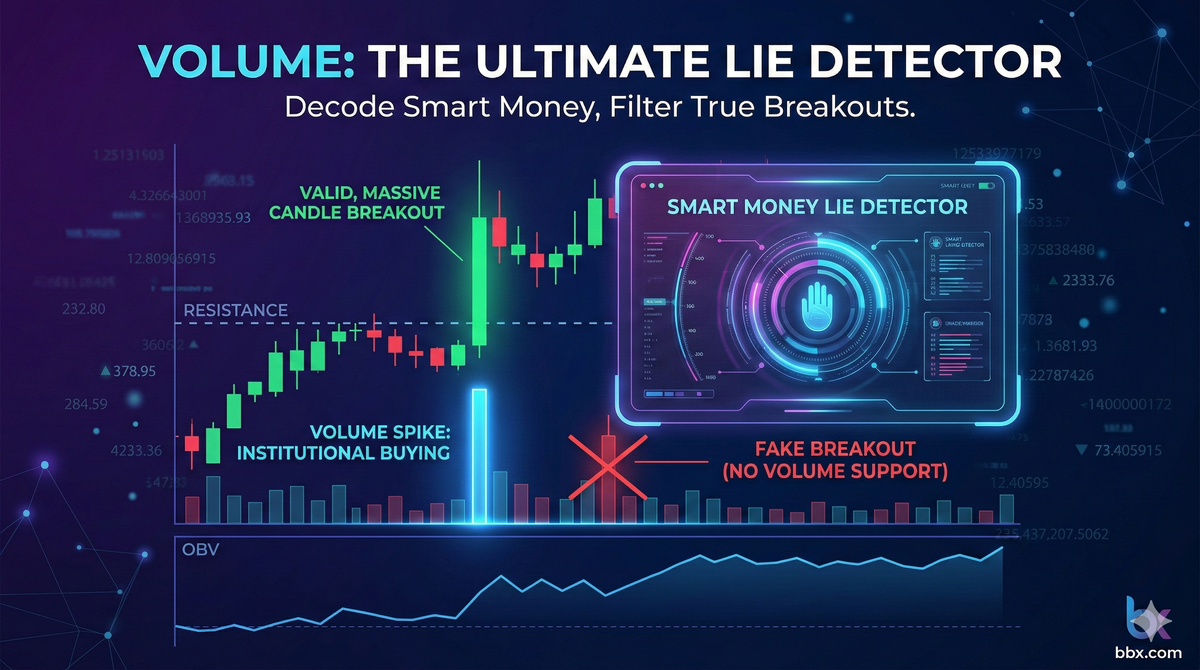
What is Volume? The Ultimate "Lie Detector" for Tracking Smart Money
Candlesticks can be manipulated, but pure trading volume cannot. Volume is the ultimate lie detector for validating market trends and breakouts. Learn how to decode price-volume relationships and avoid deadly fakeouts on bbx.com.
TL;DR (Quick Answer): The indicators we've covered previously—MACD, RSI, Bollinger Bands, and Moving Averages—are all mathematical derivatives of Price. Volume, however, is entirely independent. It records the absolute total number of shares or coins traded during a specific timeframe. It is built purely on cold, hard cash.The Golden Rule: A macro trend requires volume to sustain itself. If the price is the car, volume is the fuel.The Playbook: A Volume Spike (High Volume) indicates strong market consensus and institutional conviction. Volume Contraction (Low Volume) indicates market hesitation and exhaustion.The Ultimate Filter: A price breakout accompanied by massive volume is a true breakout. A new high on low volume is almost always a "Bull Trap" engineered by Smart Money.
1. What is Volume? The Only Undeniable Truth in Technical Analysis
In the financial markets, there is a century-old Wall Street adage: "Price can lie, indicators can be faked, but volume tells the truth." Why? Because institutional whales and market makers can easily manipulate price during low-liquidity overnight sessions, painting beautiful MACD crossovers or forcing RSI into overbought territory with relatively little capital. However, they cannot fake massive trading volume.
- The Core Display: On most charting platforms (like bbx.com), volume is displayed as a series of vertical histogram bars directly below the main candlestick chart. The taller the bar, the larger the amount of capital that changed hands during that period.
- The "Lie Detector" Principle: A price rally without the backing of massive trading volume is like a skyscraper built without a foundation—the slightest gust of wind will cause it to collapse. Volume is your ultimate lie detector for verifying the "conviction" behind any price movement.
2. The Core Cipher: The Four Laws of Price-Volume Relationship
To peek at the institutional playbook, you must constantly analyze the price action in tandem with the volume bars below it. Here are the four foundational laws every professional trader commits to memory:
1. Price Up, Volume Up (Bullish Continuation)
- The Setup: The price continuously prints higher highs, and the volume bars beneath it are progressively getting taller (expanding).
- The Signal: This is the healthiest and most aggressive bull market scenario. It proves that fresh capital is aggressively flowing into the asset. Buyers are in total control, and you should confidently hold your long positions.
2. Price Up, Volume Down (Bearish Divergence / Exhaustion)
- The Setup: The price is stubbornly pushing to new highs, but the volume bars are shrinking. This is the infamous Volume Divergence.
- The Signal: The car's accelerator is pressed to the floor, but the gas tank is empty! The willingness to buy at these elevated prices has evaporated, and the rally is surviving purely on inertia. A violent reversal is imminent. This is a strong signal to take profits.
3. Price Down, Volume Up (Panic Selling or Distribution)
- The Setup: The price violently breaks down, accompanied by massive, towering volume bars.
- The Signal: This indicates panic capitulation from retail traders or aggressive, no-cost distribution by institutional whales. During the early stages of a downtrend, a high-volume sell-off means you should never try to catch the falling knife! (Note: If this happens at the very bottom of a prolonged bear market, it could signal "Capitulation"—the final washout before a macro bottom, which should be confirmed with RSI).
4. Price Down, Volume Down (The Healthy Pullback)
- The Setup: During a clear macro uptrend, the price experiences a short-term pullback or consolidation, but the selling volume is extremely low.
- The Signal: This shows that selling pressure is virtually non-existent. Smart money is not dumping their bags; rather, impatient retail traders are simply taking minor profits. This is the quintessential "Buy the Dip" setup for trend followers.
3. Practical Application: Filtering Breakouts on bbx.com
Breakout trading is one of the most profitable strategies in technical analysis, but falling for a "Fakeout" is the fastest way to blow up an account. Volume is the ultimate filter between the two.
Tactic 1: Spotting the "Bull Trap"
When the price attempts to breach the Upper Bollinger Band, a 200-day moving average, or a historical resistance level:
- The True Breakout (Go Long): The moment resistance is breached, it is accompanied by a massive volume spike that dwarfs recent averages. This means institutions have initiated a full-scale assault. Capital is deployed. Go long with confidence.
- The Fakeout / Bull Trap (Stay Away): The price breaks to a new high, but the volume is mediocre or even declining. This is a classic "Smart Money Trap." They are engineering a fake pump to lure retail breakout-traders into buying their bags. Once retail is trapped, the price will brutally reverse and crash.
Tactic 2: Climax Volume (The Blow-Off Top)
When a raging bull market enters its final, euphoric phase, the price often goes completely vertical in an irrational frenzy known as a "Blow-Off Top."
- The Exit Signal: This vertical ascent is almost always capped by historical, towering "Climax Volume." This signifies peak retail FOMO (Fear Of Missing Out). Retail is buying everything in sight, while Smart Money is eagerly using that massive liquidity to distribute (sell) their entire holdings. Climax volume is your ultimate signal to exit the market before the inevitable crash.
4. Advanced Tactics & Traps: Dispelling Rookie Myths
The Deadliest Rookie Myth: "Red Bars Mean 100% Selling"
This is the most common misconception among novice chart readers! In any financial transaction, for every buyer, there is a seller. The volume is perfectly 1:1. So, what dictates the red or green color of the volume bar?
- The Truth: The color of the volume bar is dictated solely by the closing price of that day's candlestick. If the asset closes higher than it opened (a bullish green candle), the volume bar is painted green. If it closes lower (a bearish red candle), the bar is painted red. Volume only measures "liquidity and participation"—do not use the color to blindly calculate net inflows or outflows.
The Pro Tool: On-Balance Volume (OBV)
If reading individual volume bars feels too chaotic, you can load the OBV (On-Balance Volume) indicator in bbx.com's charting suite. OBV keeps a running total of volume—adding the volume on up-days and subtracting it on down-days—creating a smooth trendline of cumulative buying/selling pressure. If an asset's price is trading sideways in a dead, boring range, but the OBV line is quietly creeping upward, it reveals that Smart Money is stealthily accumulating a massive position. An explosive breakout is right around the corner!
Disclaimer: This report is for informational purposes only and does not constitute financial advice.