U.S. Stocks Tumble: SOXL Short Futures Grid Delivers a 227% Monthly Return
A SOXLUSDT short futures grid returned approximately 227% in 30 days with 12× leverage, an 80–170 USDT range, and 20 arithmetic grids. Explore the setup, use cases, copying options, and risks.

Summary: October brought sharp swings in U.S. stocks, with technology and semiconductor shares repeatedly changing direction. Trading was difficult; trading futures was even harder. On October 30, a broad technology sell-off sent the Nasdaq down 2.9% in a single session. Over the same market period, BBX platform data shows that one trader achieved an approximately 227% monthly return using a SOXLUSDT short futures grid, with an estimated annualized return of 2,761.83%. This article breaks down how that return was generated, when stock futures grids may be useful, and the risks traders need to understand.
1.Last Friday, the Nasdaq Fell 2.9%
U.S. stocks were difficult to trade throughout October. Futures were even tougher.
At the start of the month, the AI rally was still gaining momentum: on October 6, the Nasdaq Composite closed at a record high. Within days, sentiment shifted. Investors began questioning whether massive spending on AI infrastructure would pay off, and technology and semiconductor stocks pulled back. The market also kept reversing course: the Nasdaq fell 2.6% on October 22, only to recover those losses and gain a further 2.1% by October 28.This kind of market can be particularly punishing for futures traders. Chase a short, and a rebound can trigger your stop. Buy the dip, and the next sell-off can push prices lower again. Even if your directional view is right, poor timing can still leave you with a loss.
On Friday, October 30, 2026, the final trading day of the month, that pressure came to a head.According to the Associated Press, the S&P 500 fell 1.8%, its worst daily performance since June, while the Nasdaq Composite dropped 2.9%. Cboe market commentary reported that $NVDA fell 4.2%, with semiconductor shares broadly under pressure. The Philadelphia Semiconductor Index lost 7.2% that day, taking its monthly decline to more than 15%.
For October as a whole, the Nasdaq fell approximately 5.3%, its worst monthly performance since March 2025, and stood about 7.8% below its peak.
Sources cited in the original: AP News, “Wall Street drops to its worst day since June after the sell-off for tech stocks deepens”; Cboe Insights, “Tech Selloff Wipes Out $1 Trillion in Value”; Reuters, “October ends with a thud for Intel, Reddit, AI stalwarts”; FinancialMarkets.com, “The Nasdaq Lost 5.3% in October While the Dow Gained 1.5%”; ForkLog, “Six shocks, no panic: October in review.”
On days like that, many traders do little more than stare at their account balances.
But zoom out over the preceding month and look at the other side of the market:
BBX platform data shows that one trader achieved an approximately 227% return over 30 days using a SOXL short grid, with an estimated APR of 2,761.83%.
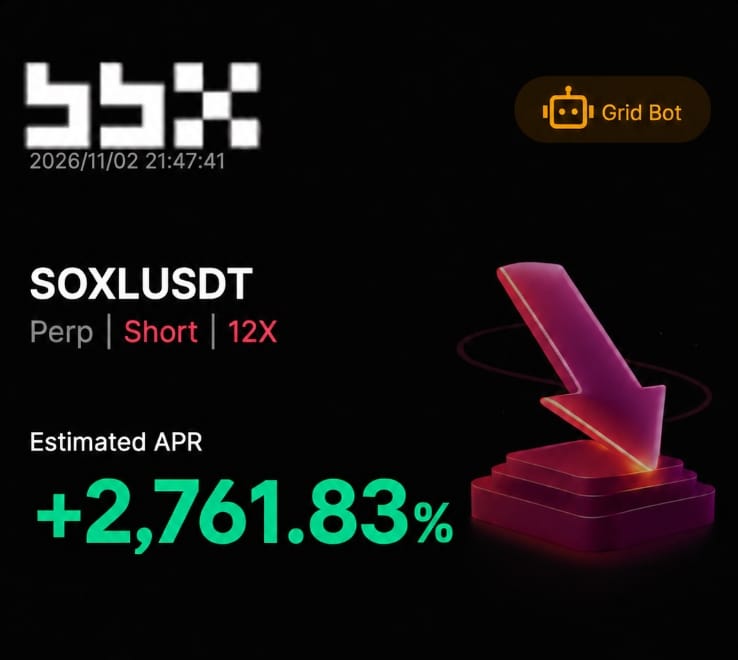
One point needs to be clear from the outset: the past 30 days will not repeat exactly, and this figure does not represent future performance.
Still, the example helps answer a useful question: what can a grid strategy actually do in a falling market?
2.Breaking Down the 227% Return
First, the parameters:
Parameter | Setting |
Contract | SOXLUSDT |
Direction | Short |
Leverage | 12× |
Price range | 80–170 USDT |
Grid configuration | Arithmetic, 20 grids |
Price interval per grid | 4.5 USDT |
Initial investment | 1,000 USDT |
Starting price | Approximately 164.01 USDT |
Result: an approximately 227% monthly return, with an estimated annualized return of 2,761.83% displayed on the strategy card.
How did it happen? There are four parts to the explanation.
First, the underlying asset is highly volatile. $SOXL is a 3× leveraged semiconductor bull ETF. A 1% decline in semiconductor stocks roughly translates into a 3% decline in the ETF. When technology stocks pull back, the move in SOXL is amplified.
Second, the strategy started from a favorable level. It began shorting at approximately 164 USDT, close to the 170 USDT upper boundary. According to public price data, $SOXL fell from above $160 to below $80 over those 30 days, briefly reaching around $70 near month-end. The grid's range covered that entire downward move. Once the price fell below 80, all of the grid's short positions had been closed, and the strategy stopped executing further trades.
Third, the decline was not a straight line. There were rebounds and reversals along the way. For example, after the sharp October 22 decline, $SOXL rebounded around October 28. Each rebound triggered sell orders to open shorts, and each subsequent pullback triggered buy orders to close them. Those matched trades turned price fluctuations into grid profits.
Fourth, 12× leverage amplified the result. With 1,000 USDT in capital, 12× leverage provides approximately 12,000 USDT in notional exposure, magnifying both returns and risk.
Put simply, the 227% return primarily came from getting the direction right and using leverage. The grid's role was to turn the back-and-forth movements during the decline into a series of matched profits, while spreading execution across multiple price levels.
3.Why Use a Futures Grid? When Can Stock Futures Grids Be Useful?
The example brings us back to a basic question: why use a futures grid instead of placing futures orders manually?Futures grids offer several potential advantages:
- Trade long, short, or neutral. A spot grid buys low and sells high, waiting for prices to recover. A futures grid can take long or short positions, or run a neutral strategy, giving traders ways to participate in falling markets as well.
- Scale into positions across multiple levels. Orders are divided across grid levels. In a short grid, positions can be added as prices rise and profits taken as prices fall, reducing reliance on a single large entry.
- Turn price swings into matched profits. Each round trip within the range can complete a buy-low/sell-high or sell-high/buy-low cycle. More back-and-forth movement can create more opportunities for matched trades.
- Automate execution and reduce emotional decisions. The bot operates 24/7 within the configured range and grid levels, reducing the need for constant monitoring and helping limit panic selling or chasing price moves.
- Improve capital efficiency. Leverage allows the same capital to support exposure across a broader range. Existing stock futures positions can also be converted directly into grids without first closing them.
Stock futures grids may be useful in the following situations:
- Volatile stocks and leveraged ETFs. Instruments such as SOXL and MSTR can experience large intraday swings, creating more potential grid-matching opportunities.
- A clear directional view, but uncertain timing. If you are bearish on semiconductors but worried about shorting after a substantial decline, a short grid can spread entries across multiple levels. If you are bullish on a stock but concerned about buying at a high, a long grid can build exposure gradually.
- Wide price swings around earnings or macroeconomic releases. When direction is unclear and prices move repeatedly up and down, a neutral grid or a wider trading range may be considered.
- Crypto traders looking to expand into U.S. stock markets. The same grid logic applies, and USDT margin provides access to U.S. stock-related price movements.
- More flexible management of existing positions. An existing stock futures position can be converted into a grid to capture price fluctuations while maintaining exposure.
There are also situations where grids may be less suitable. In a sharp, one-way rally or sell-off that carries prices beyond the range, matched-trade opportunities can become scarce, while a grid positioned against the move remains under pressure. For low-volatility instruments, grid levels may trigger infrequently, leaving little profit after trading fees.
4.Other Stock Futures Grids in the Strategy Marketplace
SOXL is not the only example. BBX's futures grid Strategy Marketplace also features popular stock futures grid strategies such as:
- SKHYNIXUSDT long grid: A 1,000–1,110 range, 10 arithmetic grids, and 10× isolated leverage, with a 30-day backtested return of +34.39%. Fewer grids and wider spacing may suit instruments with large price swings that unfold more slowly.
- MSTRUSDT long grid: A 125–140 range, 25 geometric grids, 0.45% profit per grid after fees, and 10× isolated leverage, with a 30-day backtested return of +26.96%. As of October 25, 2026, $MSTR held approximately 848,517 BTC. Its share price is closely linked to Bitcoin, making it a more familiar instrument for users who already follow crypto markets. Sources cited in the original: Strategy's Form 8-K filed with the SEC; Strategy's Q3 2026 earnings press release, October 29, 2026.
- SOXLUSDT long grid: A 68–83 range and 30 geometric grids, with a 30-day backtested return of +39.54%. Traders are using both long and short approaches on the same underlying instrument.
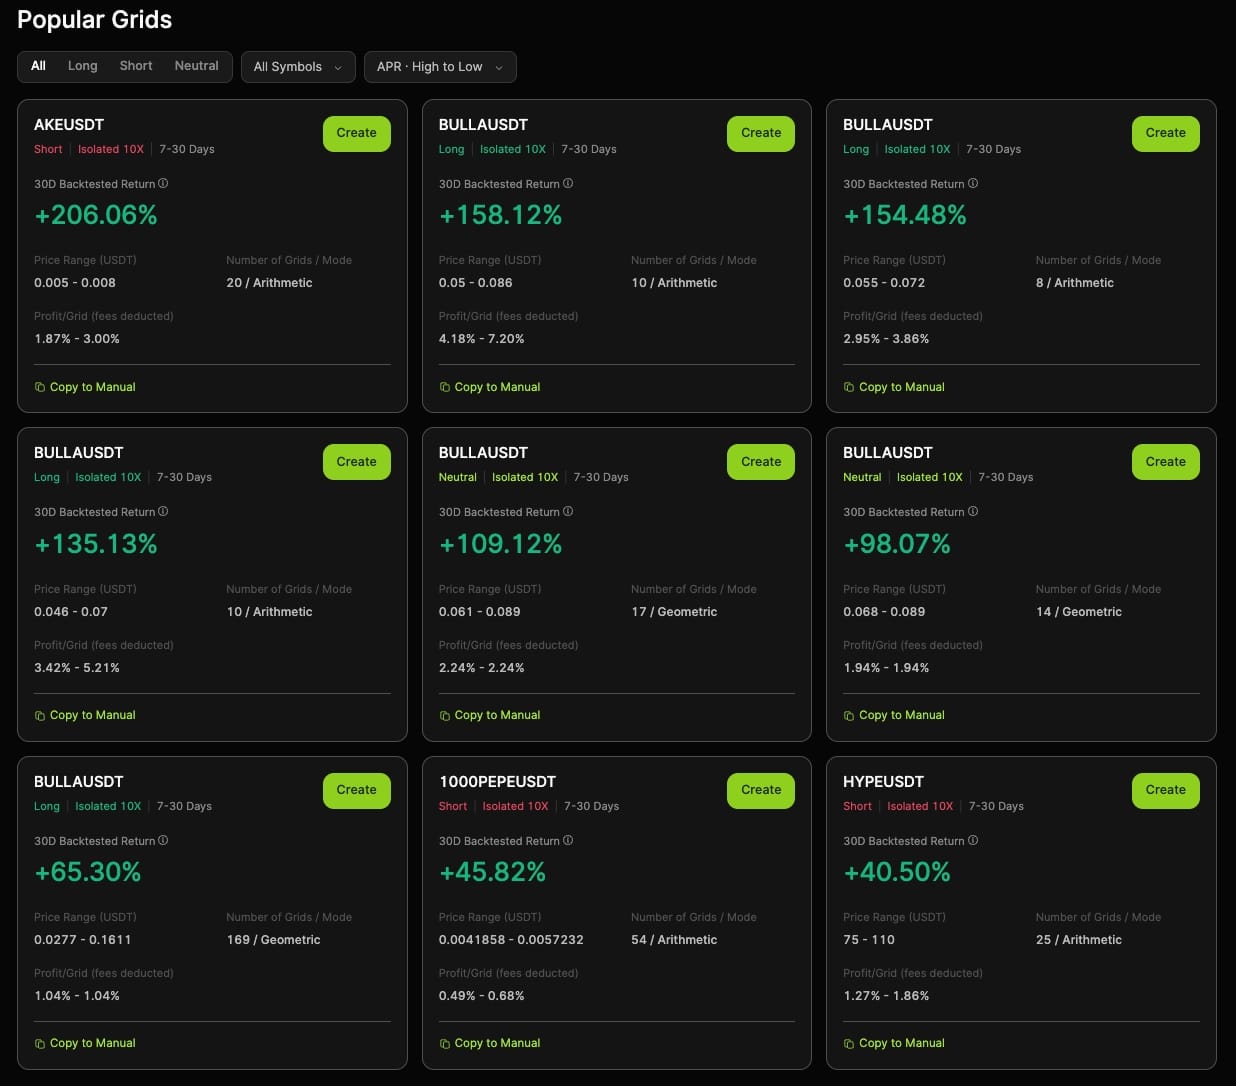
These popular strategies do not require users to configure every parameter from scratch. Select a strategy and click “Create” to launch it with its existing parameters, or choose “Copy to Manual” to carry over the price range, grid count, and leverage, then adjust them to suit your capital and risk preferences. For users new to grids, this can be a quick way to get started.
The underlying logic is the same as the grid strategies commonly used in crypto markets. Anyone who has used a BTC grid will find much of the process familiar when switching to $SOXL.
5.How to Get Started
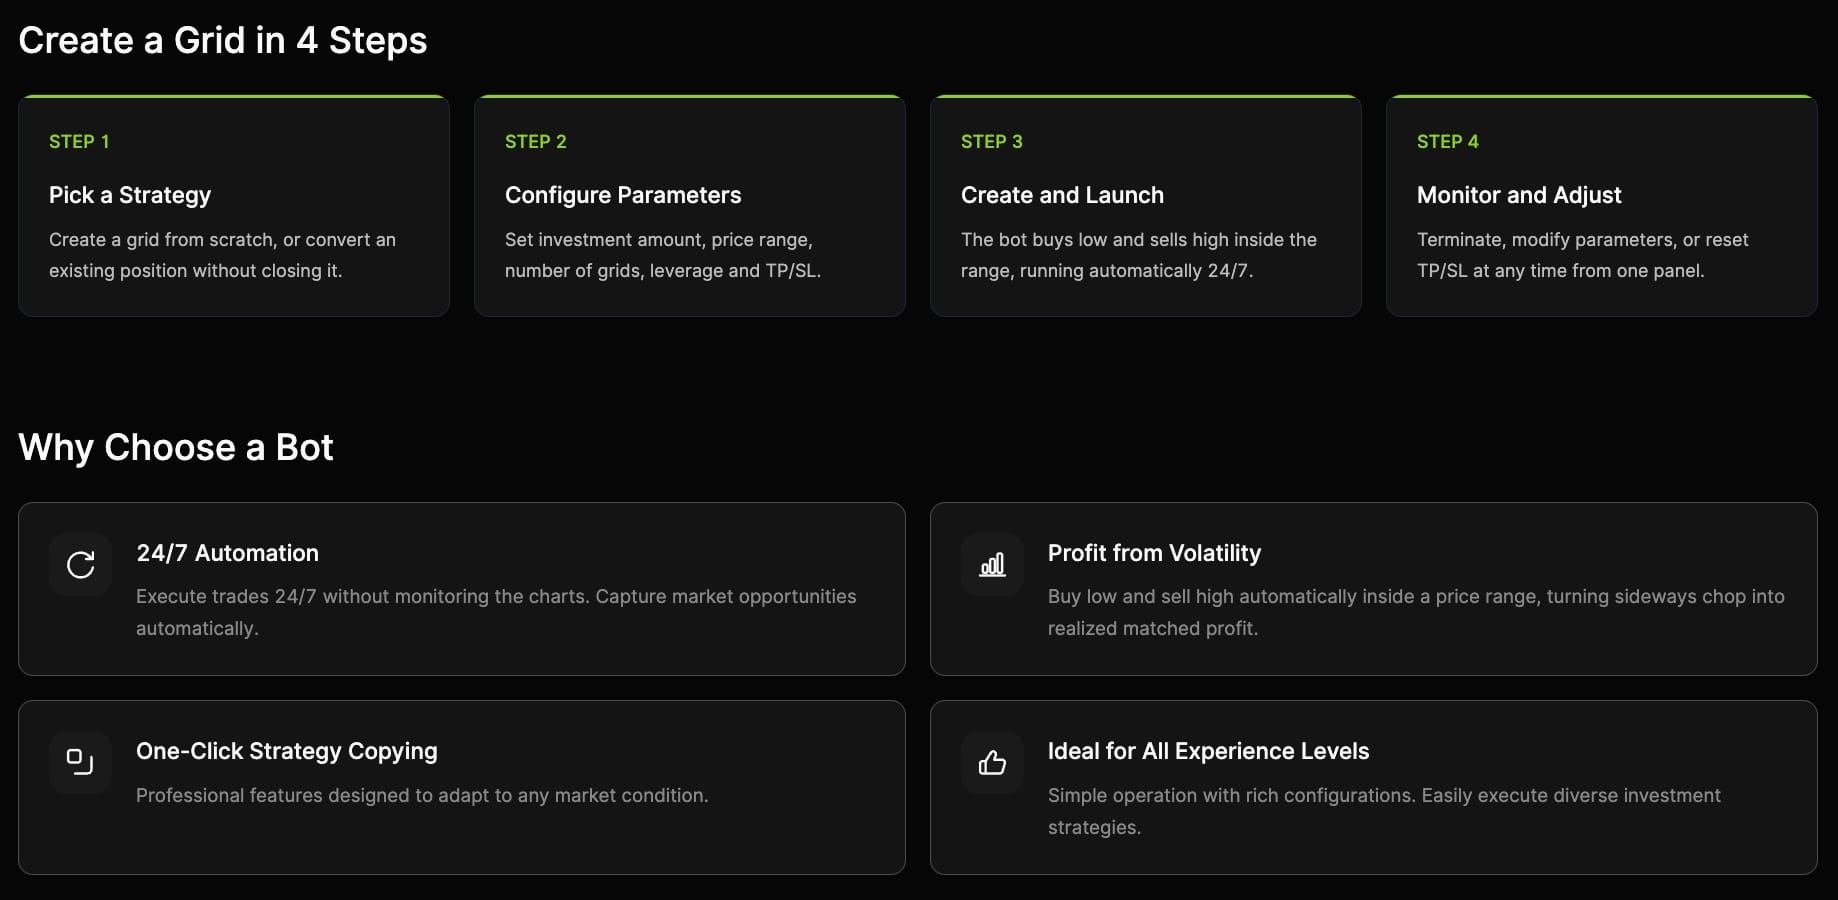
Connect your wallet on the BBX DEX Futures Grid page, or create a grid directly from the panel on the right side of a stock futures trading page.
There are three ways to create a strategy: use AI-recommended parameters based on historical data, copy an existing strategy from the Strategy Marketplace, or manually configure the direction, price range, number of grids, arithmetic or geometric spacing, and leverage.
Existing stock futures positions can also be converted directly into grids without first closing them. However, converting a position does not eliminate any existing unrealized losses.
A note on leverage: Maximum leverage for stock-related perpetual contracts on BBX varies by contract, with some supporting up to 100× leverage. Combining grids with leverage magnifies both gains and losses.
6.When Strategy Tools Become Capabilities Others Can Build On
The people who form trading views earliest are often found in research communities, trader groups, and content platforms. Some review semiconductor markets every day; others specialize in the relationship between $MSTR and Bitcoin. They understand their markets, but may lack the resources to build an entire trading system from scratch.
AZverse's proposed open financial network addresses this need. According to its official introduction, AZverse positions itself around “Compose All Finance.” Through its Composer model, different teams can share underlying liquidity, markets, and financial capabilities, then build their own financial applications on top.
Applied to stock futures grids, this means that a trading community with deep expertise in U.S. technology stocks could use the BBX and AZverse ecosystem to integrate stock futures grid capabilities and its traders' strategies into its own product. After reading a market review, users could copy the corresponding grid strategy in the same place.
7.Before Focusing on 227%, Understand These Risks
- Past performance is not future performance. The 227% figure reflects the market conditions of the preceding 30 days. Those conditions will not repeat exactly.
- Estimated annualized return is not an actual one-year return. The 2,761.83% figure extrapolates the current performance on an annualized basis. It does not mean that return will actually be achieved over a year.
- 12× leverage carries liquidation risk. A price move of just a few percentage points against the position can quickly deplete margin and potentially lead to liquidation.
- A sustained rally is a major risk for a short grid. $SOXL is a 3× leveraged ETF, so rebounds can be just as sharp as declines. If the price rises above the upper boundary, the short grid can remain under pressure and may be liquidated.
- Costs matter to the overall result. Trading fees, funding payments, and slippage all reduce returns. Overall strategy performance equals matched grid profits plus unrealized position profit or loss, minus costs.
A grid is a tool for disciplined execution, not a forecasting tool or a capital-protected arbitrage strategy. If your directional view is wrong, a grid cannot rescue it. If your view is right, it can help spread execution across multiple levels instead of committing everything at one price.
About BBX
BBX is a multi-asset trading platform that uses stablecoins as a funding gateway. BBX stock accounts provide access to real U.S. and Hong Kong stocks: U.S. stock orders are executed through FINRA-registered partner brokers, with clearing and custody provided by partner clearing institutions; Hong Kong stock orders are executed through partner brokers licensed by Hong Kong's Securities and Futures Commission.
BBX DEX supports 24/7 trading in tokenized stocks and USDT-margined multi-asset perpetual contracts, alongside automated strategy tools such as futures grids.One Account. Global Markets.
Disclaimer
This article is intended solely to introduce product features and share market information. It does not constitute investment advice, an offer, or a solicitation. Market data is drawn from public reports and may contain inaccuracies or be subject to updates. Specific products, instruments, parameters, and regional availability are subject to the information displayed on the BBX platform.
Risk Warning
Perpetual contracts and futures grids involve high-risk leveraged trading and may result in the loss of all margin. Grid strategies may incur losses or be liquidated in one-way markets, when prices break out of the configured range, or when margin is insufficient. Automated execution does not guarantee profitability. Past returns, backtests, and illustrative results are not indicative of future performance. Trading stock-related perpetual contracts does not constitute the purchase of actual shares and does not confer shareholder rights. Please participate cautiously, taking into account your risk tolerance and applicable laws and regulations in your jurisdiction.